

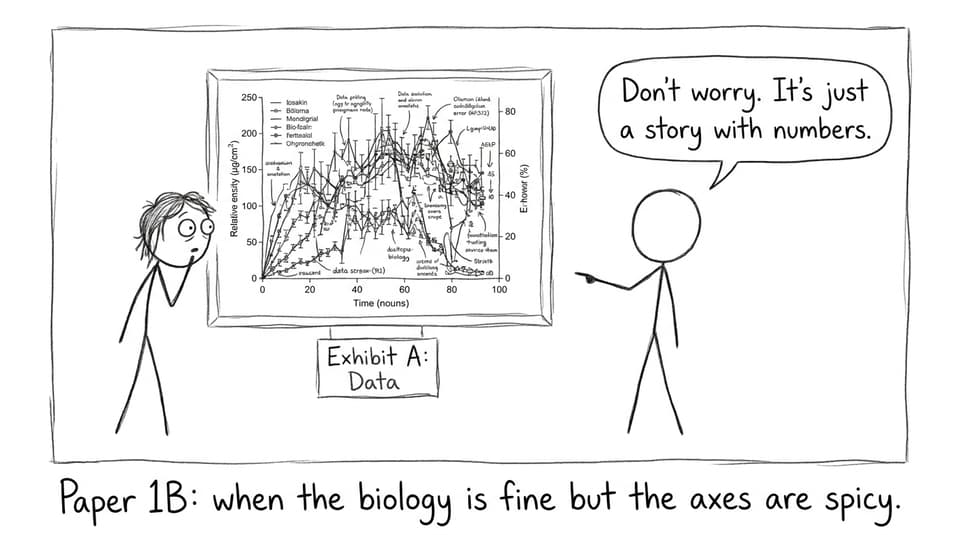
A graph can feel like a foreign language the first time you meet it in an exam. Not because you suddenly forgot IB Biology, but because the question is asking for a different kind of intelligence: patience, precision, and proof.
From 2025 onward, Paper 1B is a core part of the IB Biology assessment. It’s built to reward students who can read evidence like a scientist: notice patterns, handle uncertainty, and connect data to real biological ideas without panicking.
What Paper 1B is testing in IB Biology
Paper 1B sits inside Paper 1 time for both SL and HL IB Biology. Instead of multiple-choice, you’ll see short structured-response questions based on:
-
Experimental setups
-
Tables, graphs, and charts
-
Short real-world biological scenarios
The shift is subtle but important: Paper 1B is less about recall and more about interpretation. You still need IB Biology knowledge, but you’re graded on how you apply it to unfamiliar evidence.
For the bigger exam-picture context, see RevisionDojo’s Comprehensive Guide to IB Biology Paper 1 and Paper 2.
Beginner checklist for IB Biology data-based questions
Before you write a single sentence, run this quick mental checklist:
-
What is the independent variable and dependent variable?
-
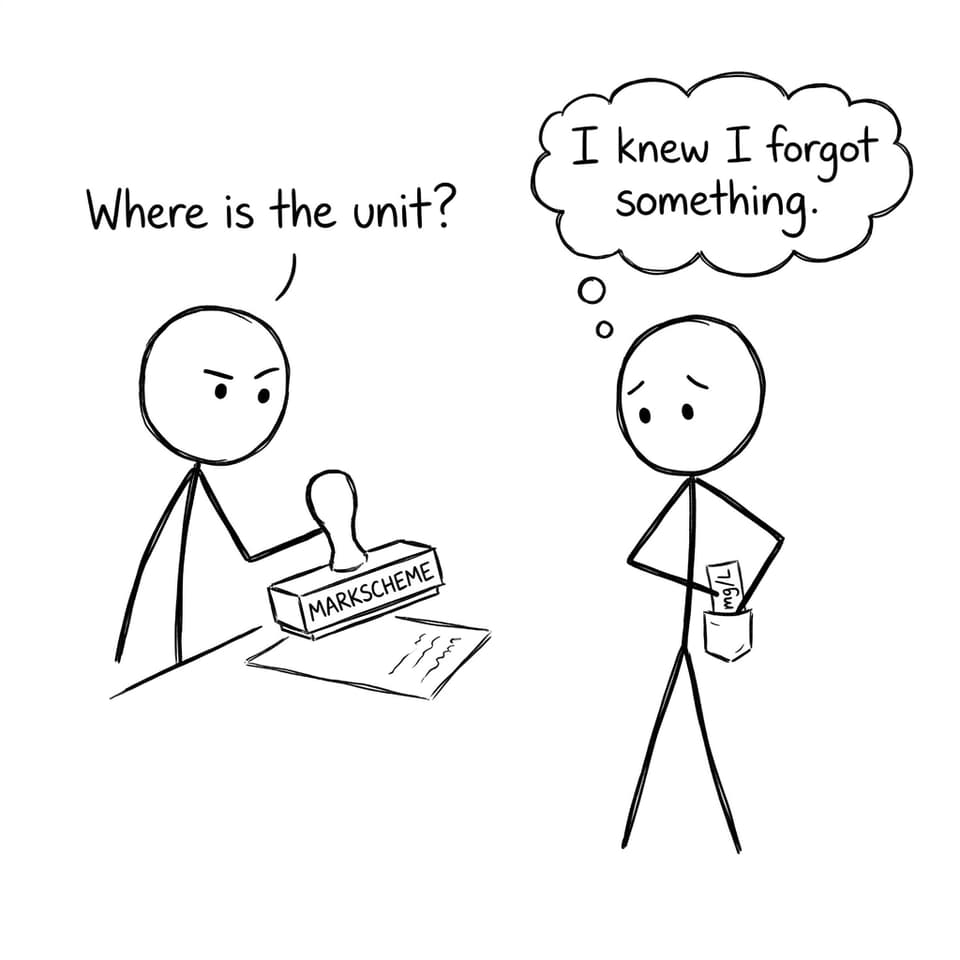
What are the units, and do they change?
-
What’s the trend: increase, decrease, plateau, optimum, correlation?
-
Are there outliers, error bars, or anomalies?
-
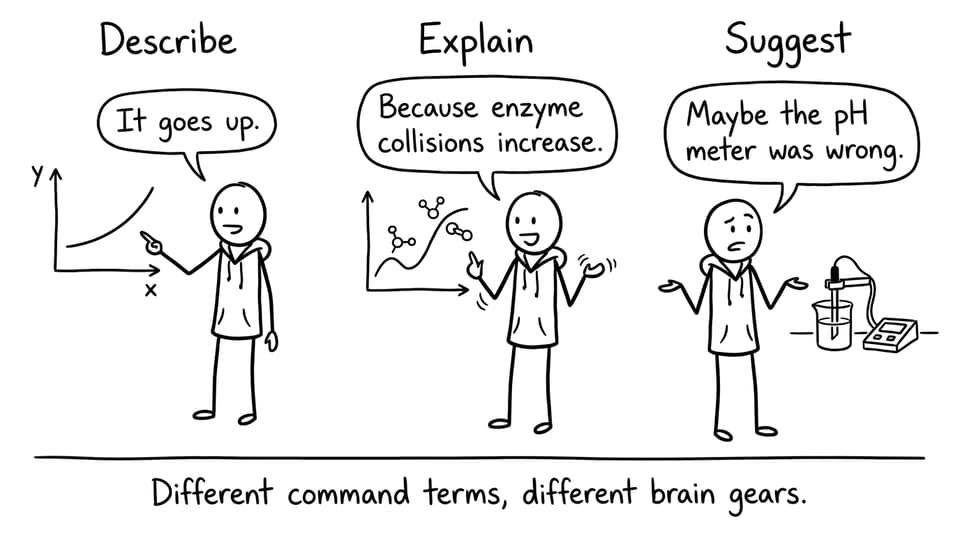
What does the question want: describe or explain or suggest?
If you want a structured place to practice this repeatedly, start at the IB Biology Resources hub and use the Questionbank + AI feedback loop.
How to answer Paper 1B step by step (without overthinking)
Start with the scenario, not the graph
In IB Biology, the scenario is often the “translation key.” Read it first and ask:
-
What is being tested or compared?
-
Which variable was changed?
-
What biological topic is this probably linked to (enzymes, transport, ecology, etc.)?
Then look at the visual data. This order stops you from free-styling an explanation that doesn’t match the experiment.
Read axes like they are part of the question
Most lost marks in IB Biology Paper 1B come from tiny avoidable things: misread scales, ignored units, or swapped variables.
A useful habit is to say (in your head): “x causes y.” If x and y don’t make sense with the scenario, pause and re-check.
“Describe” first, then “Explain”
Paper 1B questions often reward a clean two-layer response:
-
Describe = what the data shows (with numbers)
-
Explain/Suggest = why it might look that way (with biology)
A strong “describe” line sounds like:
As temperature increases from 20°C to 40°C, enzyme activity rises from about 10 to 35 units, then decreases beyond 40°C.
Notice what makes it score: trend + specific values + units. That is IB Biology marking logic.
Link trends to a small piece of theory, not the whole chapter
When you explain, keep the theory tight. Pick one mechanism that genuinely fits:
-
enzyme denaturation and active site shape
-
diffusion gradients and membrane permeability
-
limiting factors in photosynthesis/respiration
-
sampling error and biological variation
If the question invites evaluation, add one realistic limitation (small sample size, uncontrolled variable, instrument precision) and tie it back to reliability.
To sharpen the exact verbs and what they demand, read How to Understand IB Biology Command Terms for Exam Success.
Practice that actually matches IB Biology Paper 1B
You don’t get better at Paper 1B by only rereading notes. You improve by seeing lots of messy datasets until they stop feeling messy.
A high-signal routine:
-
Drill timed sets in the Cell Biology questionbank
-
Mix in unfamiliar contexts like Molecular Biology questionbank
-
Add interpretation-heavy topics like Ecology
-
When you miss a question, ask RevisionDojo AI Chat to explain the markscheme logic, then rewrite your answer in one cleaner version
When you’re ready to simulate the real feel of Paper 1B, use Biology Predicted Papers and add timed runs with Mock Exams and Grading tools.
Closing: make IB Biology Paper 1B feel predictable
Paper 1B becomes easier when you stop treating data as a trap and start treating it as a story that needs evidence. In IB Biology, the winning habit is simple: read the setup, name the variables, describe with numbers, then explain with one clean mechanism.
If you want that routine to become automatic, use RevisionDojo as your home base: the Questionbank for repetition, Study Notes and Flashcards for quick recall, AI Chat for markscheme-style explanations, and Mock Exams plus Predicted Papers for exam-day pressure practice. Paper 1B isn’t asking for more memorization. It’s asking you to think like a scientist you already are.