
The moment climate change stops being “an idea”
At some point in every IB ESS class, climate change shifts from a debate into a dataset. You see a temperature curve. A CO₂ line that climbs without apology. A sea level trend that looks calm until you notice the timescale. And you realize something uncomfortable: the planet keeps receipts.
For IB ESS students, that’s good news. Exams reward evidence, not vibes. If you can explain how climate change is measured, you can handle data-response questions, evaluate uncertainty, and write essays that feel grounded.
Climate change measurement checklist (IB ESS edition)
When you’re revising IB ESS, keep this quick checklist in mind. Climate change is measured by tracking:
-
Atmospheric temperature (surface + lower atmosphere)
-
Greenhouse gas concentrations (CO₂, CH₄, N₂O in ppm/ppb)
-
Ocean heat and sea level rise
-
Cryosphere change (glaciers, sea ice, ice sheets)
-
Satellite observations (albedo, clouds, vegetation, aerosols)
-
Climate models (projections + uncertainty)
For the syllabus pathway, start with Topic 6: Atmosphere and climate change and then connect it to Climate change and energy production Notes.
Temperature records: the most quoted line in climate science
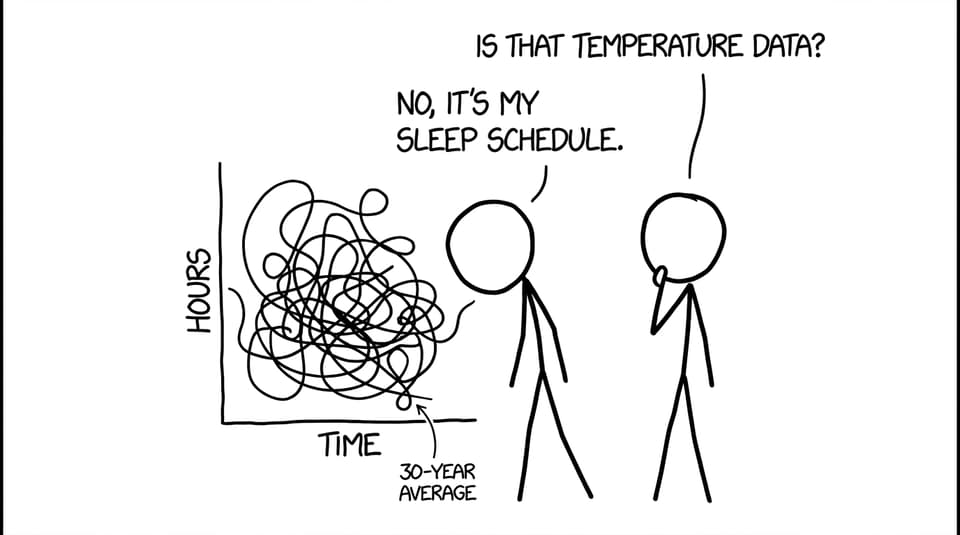
Temperature is the headline indicator because it’s direct: warming means the global energy balance has shifted. Scientists compile global datasets using weather stations, ocean buoys, and satellites, then calculate long-term trends (think “climate” as 30+ year averages).
A key figure you should know for IB ESS essays: global average temperature has risen by about 1.1°C since pre-industrial times. In exams, you’re often asked to interpret anomalies, justify the use of averages, or comment on how datasets are standardized.
To reinforce the greenhouse foundation behind these trends, pair your notes with 6.1C Greenhouse effect and the supporting Notes for 6.1C Greenhouse effect.
Greenhouse gases: measuring the cause, not just the symptom
If temperature is the “what,” greenhouse gases are the “why.” CO₂, methane, and nitrous oxide are measured with atmospheric sensors at monitoring stations (for example, Mauna Loa) and compared with older records from ice cores.
In IB ESS, it helps to phrase this like an examiner: greenhouse gas concentration data provides evidence of an enhanced greenhouse effect, and ice cores provide a baseline for natural variability over long timescales.
A high-yield revision page here is Notes for 6.2 Climate change - causes and impact.
Oceans and sea level: the quiet giant of climate evidence
The ocean is where much of the extra heat ends up. It absorbs over 90% of excess heat trapped by greenhouse gases, which is why ocean heat content is one of the strongest lines of evidence.
Sea level rise is measured using tide gauges and satellite altimeters. In IB ESS, link sea level rise to two main drivers: thermal expansion (warmer water takes up more space) and melting land ice.
When you practice data questions on this, you’ll notice the exam likes “outline the trend” first, then “explain” using processes. Build that skill with the 6.2 Climate change - causes and impact Questionbank.
Ice cores, glaciers, and sea ice: time machines with error bars
Ice cores from Antarctica and Greenland trap tiny air bubbles, letting scientists estimate past greenhouse gas concentrations and infer temperature relationships across hundreds of thousands of years.
Modern cryosphere monitoring (glacier retreat, shrinking sea ice extent, ice sheet mass loss) adds a present-day confirmation. In IB ESS terms, ice cores are a long-term proxy, while satellites and field measurements provide current, high-resolution evidence.
Want exam-style prompts that actually match this? Use Topic 7: Natural resources - IB Questionbank for climate-linked evaluation questions (mitigation, adaptation, value systems).
Satellites and remote sensing: seeing the whole system at once
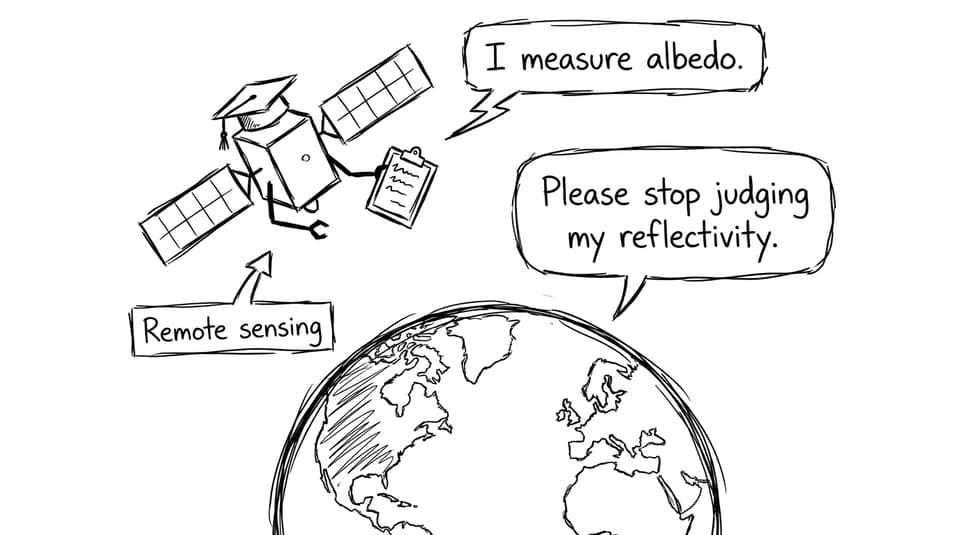
Satellites are essential because climate is global. They help measure albedo (reflectivity), cloud cover, aerosols, vegetation change, and even sea surface temperature patterns.
For IB ESS, the systems-thinking angle matters: remote sensing connects the atmosphere, hydrosphere, biosphere, and cryosphere in one picture, which is exactly what Paper 2 essays want.
Climate models: how IB ESS expects you to talk about uncertainty
Climate models simulate interactions between spheres and include feedback loops like ice-albedo feedback and carbon cycle feedback. Your job in IB ESS isn’t to memorize every model type; it’s to explain what models do, and how scientists manage uncertainty:
-
Use multiple datasets and independent indicators (temperature + CO₂ + ice + sea level)
-
Compare model scenarios rather than pretending there’s one “future”
-
Communicate confidence levels and limitations clearly
If you need quick clarity on terminology that often gets mixed up in essays, read What Is the Difference Between the Greenhouse Effect and Global Warming?.
Bring it together: turn evidence into marks with RevisionDojo
Climate change measurement can feel like a pile of graphs until you see the pattern: multiple indicators, across multiple systems, telling the same story. That’s the heart of IB ESS.
If you want to revise this like the exam expects, use RevisionDojo’s Study Notes, Flashcards, and Questionbank to learn and apply the indicators, then sharpen your writing with AI Chat and Grading tools. When you’re ready for timed practice, add Predicted Papers via Environmental systems and societies Predicted Papers and explore the broader workflow from RevisionDojo App: The Smarter Way to Prep for IB Exams. For sustainability framing, connect this topic to What Is a Carbon Footprint? | IB ESS Sustainability and Climate Guide.
When your next IB ESS question asks “How do we know?”, you won’t reach for a slogan. You’ll reach for measurements.