

A quick story: the moment the graph finally made sense
In IB Economics, supply diagrams can feel strangely personal. You revise the same graph three times, and it still refuses to behave. Then one day you read a case about a factory installing robots, and it clicks: the curve isn’t “moving” because the price changed. It shifts because the whole cost reality of production changed.
That’s exactly what technology does. When technology improves, firms can usually produce more output with the same inputs (or the same output with fewer inputs). In diagram terms, that means a rightward shift of the supply curve.

IB Economics checklist: what to write in an exam
When a question asks how technology affects supply in IB Economics, use this mini-checklist:
-
State the key mechanism: technology lowers costs of production.
-
Link to supply: firms are willing and able to supply more at every price.
-
Diagram: supply curve shifts right from S1 to S2.
-
Market result (if demand is unchanged): lower equilibrium price and higher equilibrium quantity.
-
Add a real-world example: automation, logistics software, precision farming, AI forecasting.
If you need a fast refresher on the basics, revisit The Supply Curve (2.2.2) notes and Supply topic hub (2.2).
Why technology improvements shift supply right
Lower unit costs: the quiet reason the curve shifts
Technology improvements often reduce average costs and sometimes marginal costs. Think automation in packaging, better inventory systems, or machines that waste fewer raw materials. If each unit costs less to make, firms can profitably supply more units at every price.
In IB Economics, that’s your clean cause-and-effect chain:
Technology improves --> costs fall --> profitability rises --> supply increases --> supply curve shifts right.
To sharpen your diagram language, practice with Movements along and shifts of the supply curve (2.2.5) and the matching shifts flashcards.
Higher productivity: more output per hour, less drama per unit
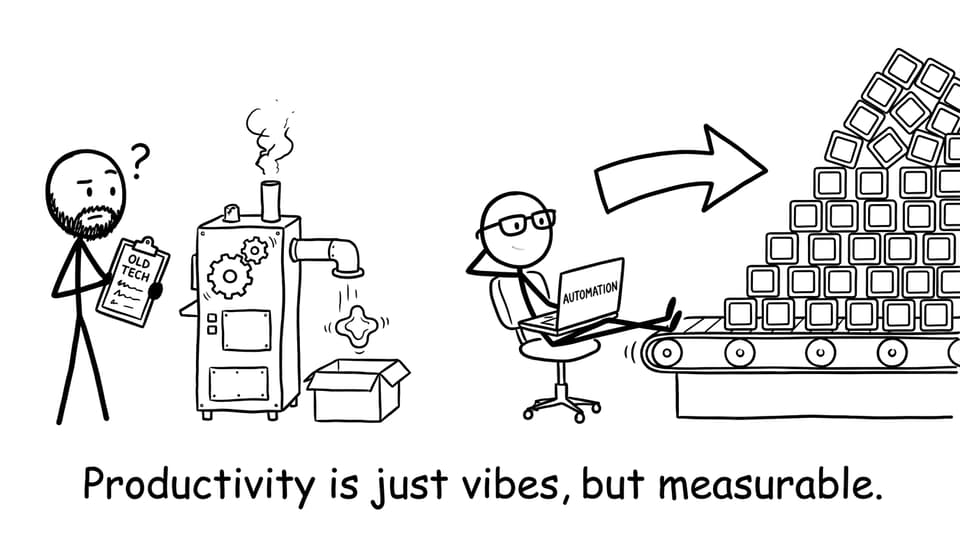
Productivity is basically “how much output you get from a given amount of inputs.” Better technology lets workers produce more in the same time, with fewer mistakes and less downtime. In manufacturing, robotics can reduce defects. In services, software can streamline tasks that used to take hours.
That productivity increase feeds into lower costs and higher potential output, pushing supply right.
Better resource allocation: fewer bottlenecks, less wasted fuel
Some tech doesn’t “make” the product, but it makes production smoother. Logistics optimization reduces transport waste. Monitoring systems reduce machine breakdowns. Forecasting tools reduce over-ordering and stockouts.
In exam wording: technology can reduce inefficiency and bottlenecks, increasing the quantity firms can supply across price levels.

How to phrase this in IB Economics exam style
A high-scoring explanation usually has:
-
A precise definition (supply, shift vs movement)
-
A correctly labeled diagram
-
A short chain of reasoning
-
A concluding sentence about equilibrium effects
If you’re building broader context, connect it to market outcomes using Demand and supply forming market equilibrium (2.3.1) and the bigger-picture explainer Define Supply and Demand (microeconomics essentials).
Bring it home: make the curve shift on purpose
Technology improvements shift the supply curve because they change what firms can do at every price level--usually by lowering costs, boosting productivity, and reducing bottlenecks. In IB Economics, that’s a diagram you want to recognize instantly.
To lock it in, use RevisionDojo as your full micro toolkit: practice with the Questionbank, reinforce definitions with Flashcards, tighten explanations with Study Notes, and pressure-test your diagrams with Mock Exams and Predicted Papers. When you get stuck, AI Chat can walk through your chain of reasoning, and Grading tools can help you spot where marks are being left on the table. Start with IB Economics resources and build the habit of making every diagram tell a clean story.