In IB Biology, cladograms can feel like the exam is asking you to read a family tree drawn by someone in a hurry. Two species sit next to each other, a few branches split, and suddenly you’re meant to infer ancestry, shared traits, and what evolved when. But a cladogram is calmer than it looks: it’s simply a visual argument about evolutionary relationships based on shared derived characteristics.
If you can learn to spot what the diagram is claiming (and what it’s not claiming), you’ll pick up quick marks in classification, phylogeny, and data-based questions.
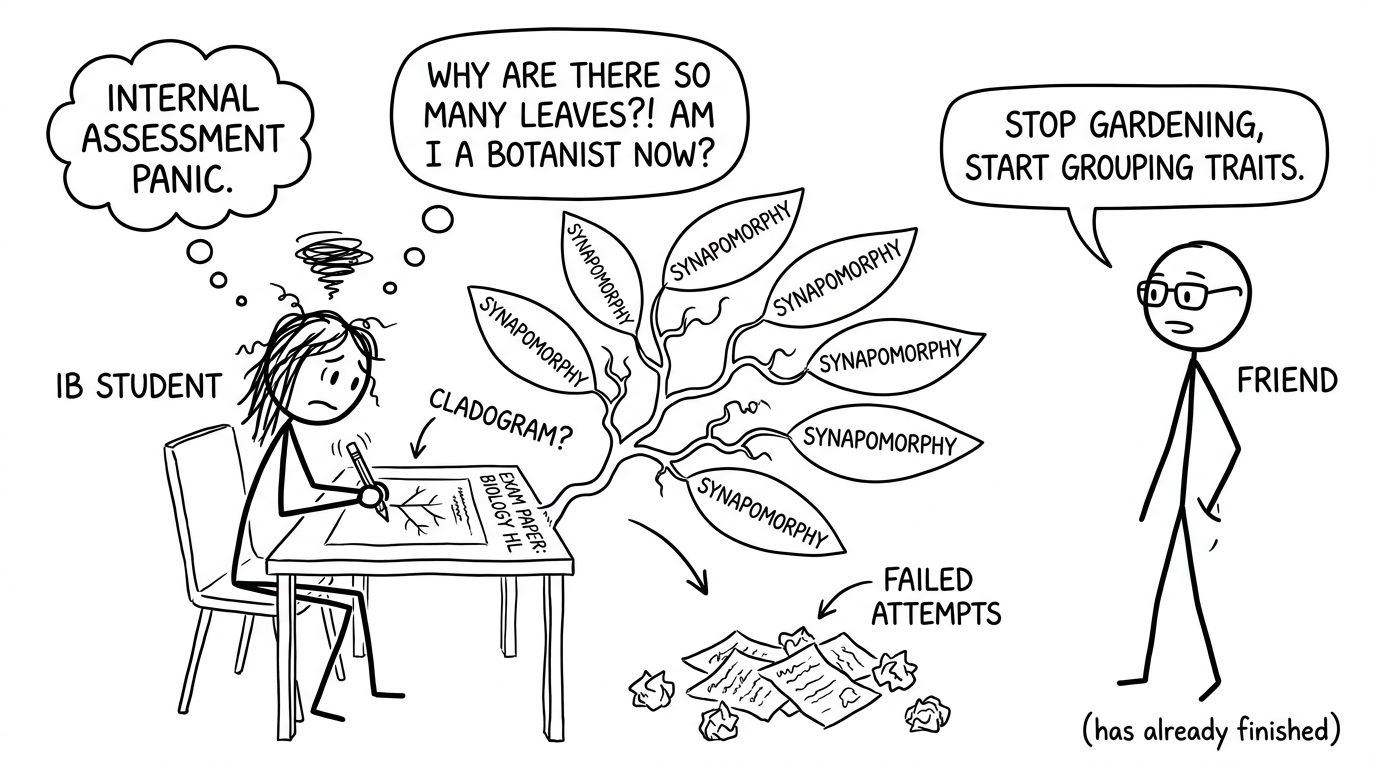
An IB student accidentally turns a cladogram into a literal tree
Quick exam checklist for reading cladograms (IB Biology)
Use this fast checklist in IB Biology exams:
Identify the nodes: each node represents a common ancestor.
Count the nodes between two taxa: fewer nodes usually means more closely related.
Look for synapomorphies (shared derived traits): these define clades.
Ignore left-to-right order: the branching pattern matters, not the layout.
Don’t assume time or “amount of evolution” unless a scale is shown.
For concise definitions you can quote accurately, keep the IB Biology Key Definitions open while you revise.
How cladograms illustrate evolutionary relationships
A cladogram groups organisms into clades: an ancestor and all of its descendants. In IB Biology, the key idea is that the branches are built using shared derived characteristics (synapomorphies), not just “looking similar.”
For example, if a trait evolved in one ancestral lineage and is present in all descendants, it becomes a powerful clue for grouping. That’s why cladograms are so useful: they turn evolution into a pattern you can test.
When you revise, pair your understanding with targeted practice. The 5.4 Cladistics Questionbank is ideal for drilling the exact interpretation moves examiners expect.
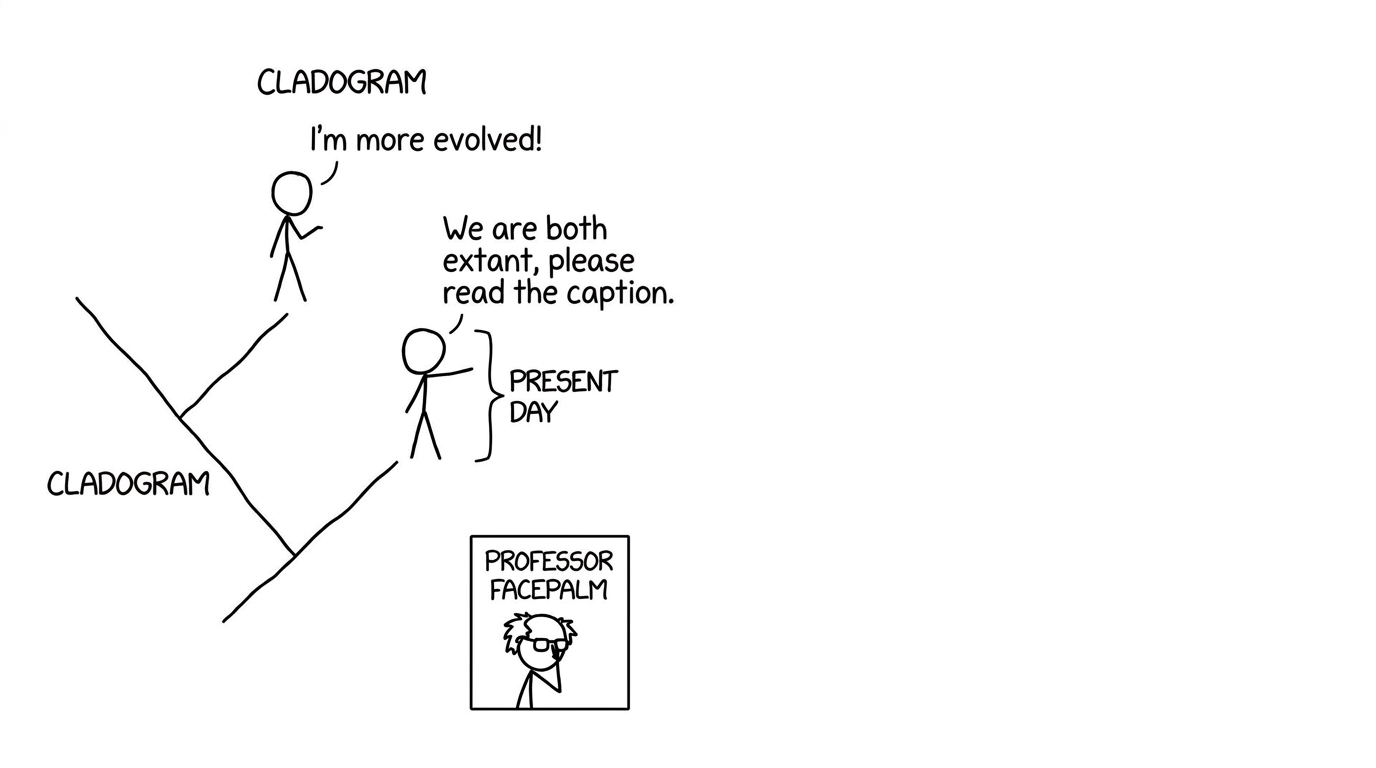
Nodes, branches, and the trap of “more evolved”
In IB Biology, a common mistake is thinking the organism at the “end” of a branch is the “most evolved.” A cladogram does not rank species by progress. It shows relatedness.
A node is the most recent common ancestor of the lineages that split from it.
A branch is a lineage through time.
Two species that share a more recent node are more closely related than two species whose most recent shared node is deeper in the diagram.
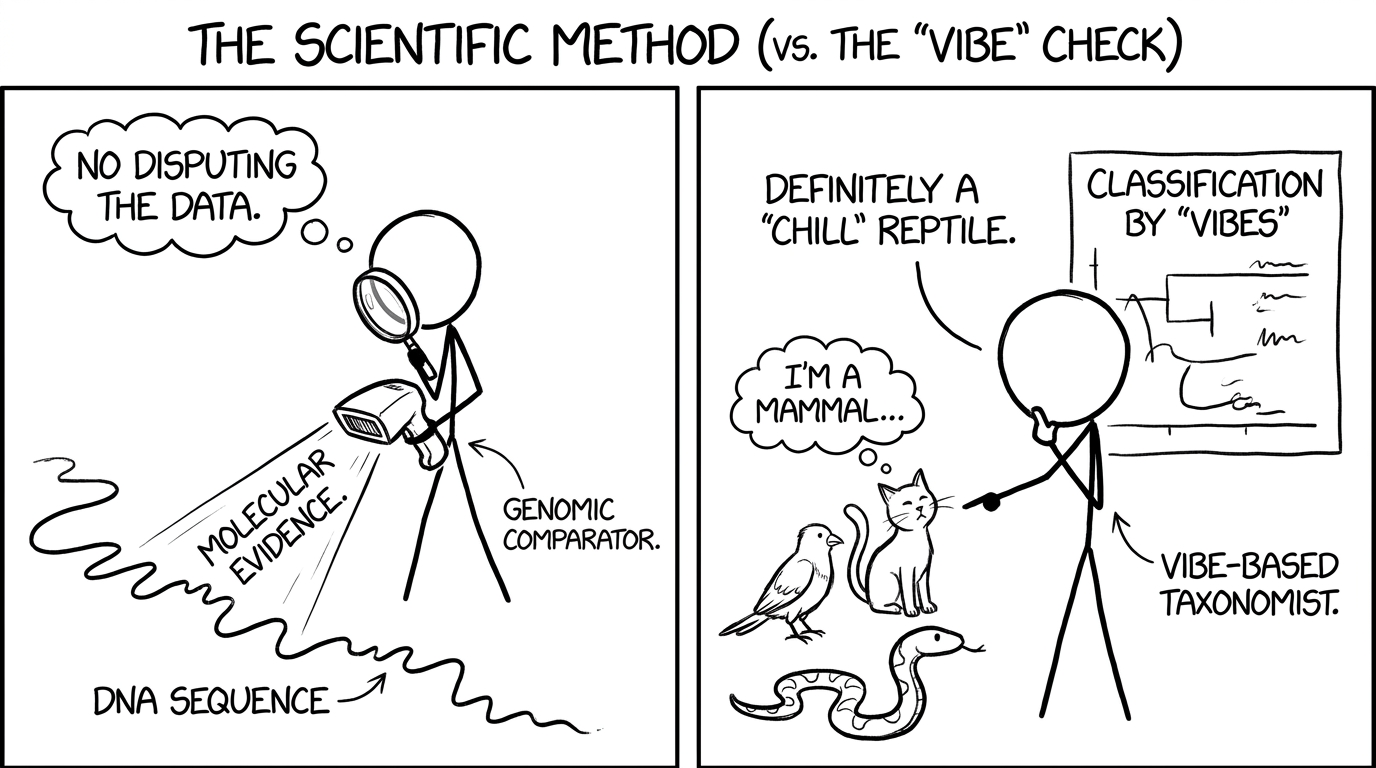
Where molecular evidence fits (and why it matters)
Modern cladistics often relies on molecular evidence: DNA base sequences or amino acid sequences. In IB Biology, this matters because it’s less subjective than appearance. Convergent evolution can make unrelated species look similar, but their sequences often reveal different histories.
Use AI Chat to ask, “Which trait here is derived vs ancestral?” and get instant feedback.
When you’re ready, build Mock Exams and use Grading tools to check whether your explanations match markscheme logic.
If coursework overlaps (classification/ecology links), the Coursework Library and Tutors can help you frame evidence cleanly.
FAQ
Do cladograms show which species are “more evolved” (IB Biology)?
No, and in IB Biology this is a high-frequency misconception. Every living species at the tips of the branches has been evolving for the same amount of time since their last common ancestor. A cladogram is about branching order, not a ladder of improvement. The diagram tells you which species share a more recent ancestor, not which one is “better” or “advanced.” If a question asks about being “more closely related,” translate it into “shares a more recent common ancestor.” That wording will keep your answer aligned to what IB examiners actually mark.
What decides where a node goes on a cladogram?
In IB Biology, nodes are placed based on evidence that a split occurred from a common ancestor, usually using synapomorphies and/or molecular data. A node represents the most recent common ancestor for the lineages that branch from it. The traits used should be shared derived characteristics, not ancestral traits shared by many groups. This is why picking the right character matters: it changes which organisms form a clade. In exam questions, you often infer node placement by identifying which trait appears “after” a particular branch point. If the question includes sequence data, that evidence can override what appearances suggest.
Can cladograms change when new evidence appears?
Yes, and IB Biology expects you to understand why. Cladograms are scientific models, not permanent truth tables. When new genetic sequences, protein comparisons, or better sampling becomes available, the most parsimonious arrangement of clades may change. This is especially common when earlier classification relied heavily on morphology and later studies revealed convergent evolution. In other words, the cladogram updates because the evidence got stronger, not because scientists are guessing. A good concluding line in longer responses is that “phylogenies are revised as molecular evidence accumulates.”
Final takeaway: treat the cladogram like an argument
In IB Biology, cladograms illustrate evolutionary relationships by making one disciplined claim: organisms are grouped by shared ancestry supported by shared derived characteristics and, increasingly, molecular evidence. Read the branches, respect the nodes, and don’t invent a timeline that isn’t there.
When you want to make this feel effortless, use RevisionDojo to cycle through Study Notes, Flashcards, and the Questionbank, then stress-test your understanding with AI Chat and exam-style Mock Exams. That combination turns cladograms from “diagram panic” into predictable marks.
· 6 min read
IB Biology: Reproductive Isolation and Speciation
IB Biology guide to how reproductive isolation leads to speciation, with prezygotic vs postzygotic barriers, allopatric vs sympatric, and exam tips.