
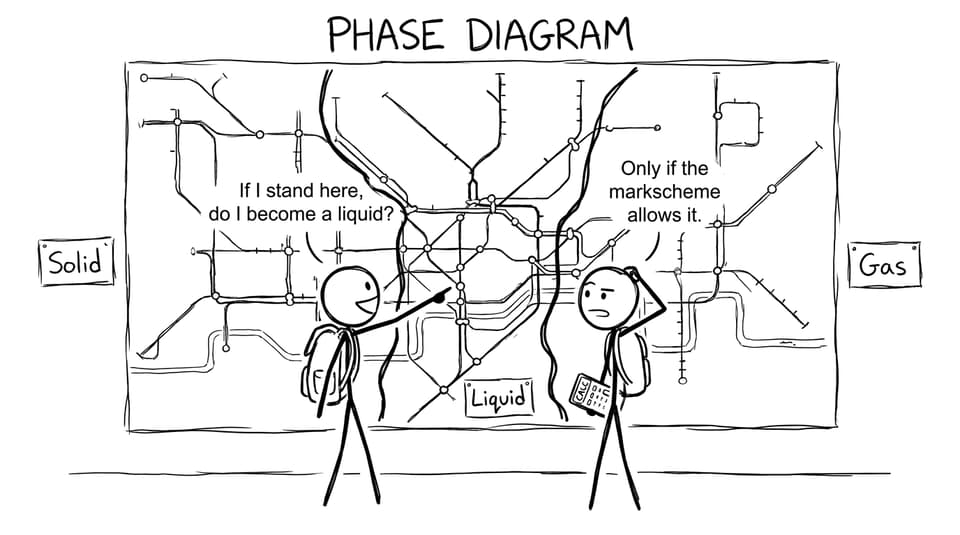
A phase diagram can feel like a map drawn by someone who assumes you already know where you are.
You stare at the lines, the labels, the tiny “point” that apparently changes everything, and your brain does the most human thing possible: it tries to memorise the picture instead of understanding the story.
In IB Chemistry, that usually backfires. Because phase diagrams are not art. They’re decision tools. They tell you what state is stable at a given temperature and pressure, and what has to happen for a substance to switch states.
Phase diagrams in IB Chemistry: the 20-second idea
A phase diagram is a pressure versus temperature graph showing which phase (solid, liquid, gas) is most stable.
Keep this quick checklist in mind (especially for exam questions):
-
Axes: temperature on x-axis, pressure on y-axis
-
Regions: solid, liquid, gas
-
Lines/curves: boundaries where two phases coexist in equilibrium
-
Special points: the triple point and the critical point
-
Movement: left/right changes temperature, up/down changes pressure
If you want a clean home base for your revision setup, start at the IB Chemistry Resources hub and keep it open while you practise.
What the lines actually mean (and why examiners care)
In IB Chemistry, the most common mistake is thinking the lines show “where a change happens.” They do, but with a specific meaning: the line is where both phases are stable together.
That matters because on a boundary line, the system can switch either way depending on energy flow. It’s not “mid-transition” forever. It’s at equilibrium.
Fusion curve (solid to liquid boundary)
This boundary separates solid and liquid.
-
Crossing it from solid to liquid is melting.
-
Crossing it from liquid to solid is freezing.
-
For most substances, the fusion curve slopes up: higher pressure tends to favour the denser phase.
In IB Chemistry, water is the famous exception (more on that below).
Vaporisation curve (liquid to gas boundary)
This line separates liquid and gas.
-
Crossing it from liquid to gas is boiling.
-
Crossing it from gas to liquid is condensation.
-
It ends at the critical point, where liquid and gas stop being distinct.
When you revise equilibrium language, it pairs nicely with phase boundaries. See Dynamic equilibrium explained for IB Chemistry for the “rates equal” phrasing examiners love.
Sublimation curve (solid to gas boundary)
This line separates solid and gas.
-
Solid to gas: sublimation
-
Gas to solid: deposition
Deposition is a frequent “spot the process” trap. If you want a tight definition with exam wording, read IB Chemistry: Deposition explained simply.
The triple point: one coordinate, three phases
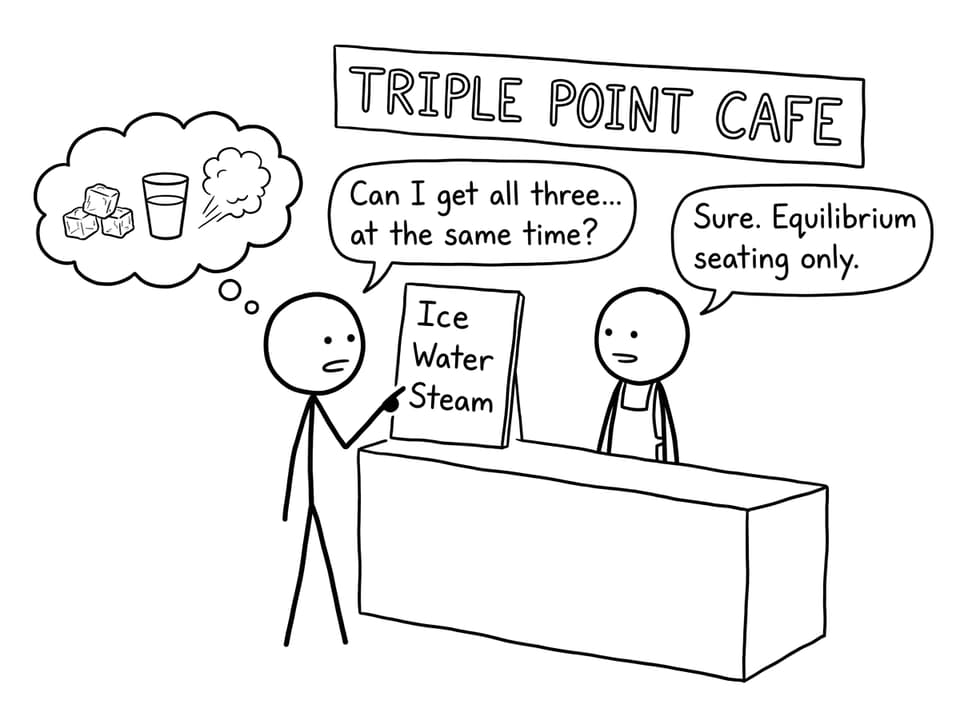
The triple point is where the three phase boundaries meet.
In IB Chemistry, the best exam phrasing is:
- The triple point is the unique temperature and pressure at which solid, liquid, and gas coexist in equilibrium.
For water, it occurs at 0.01°C and 0.006 atm.
A powerful implication: below the triple point pressure, the liquid phase cannot exist. So if a question describes “no liquid possible under these conditions,” your brain should immediately ask: are we below the triple point pressure?
The critical point: where the boundary ends
The critical point is the end of the liquid to gas equilibrium curve.
At the critical temperature and critical pressure, liquid and gas become indistinguishable and the substance forms a supercritical fluid.
In IB Chemistry, the most testable takeaway is:
- Above the critical temperature, a gas cannot be liquefied by pressure alone.
For water, it’s around 374°C and 218 atm.
If you want a focused explanation with the exact “meniscus disappears” language, use IB Chemistry: Critical point explained simply.
How to read phase diagram questions quickly
Most exam questions are really asking you to do one of two things: identify a region or trace a path.
Identify the phase at a point
-
Find the coordinate.
-
See which region it lies in (solid, liquid, or gas).
-
If it’s on a line, state two phases in equilibrium.
Predict the change along a path
-
Move horizontally to model changing temperature at constant pressure.
-
Move vertically to model changing pressure at constant temperature.
-
Each time you cross a boundary, name the phase change.
Then practise until it’s automatic. RevisionDojo’s IB Chemistry Questionbank is ideal here because phase-diagram questions reward repetition more than rereading.
Water vs CO2: the “weird slope” that shows up everywhere
In IB Chemistry, water is special because the solid to liquid boundary has a negative slope.
Translation:
-
Increasing pressure can favour liquid water over ice.
-
Ice is less dense than liquid water.
-
Water expands on freezing.
CO2 behaves more “normally,” and there’s a practical exam consequence:
-
At 1 atm, CO2 does not have a liquid phase.
-
Solid CO2 (dry ice) sublimes directly to gas.
-
Its triple point pressure is above atmospheric pressure.
If you want to reduce the stress of remembering facts, keep a one-page summary nearby. RevisionDojo’s IB Chemistry Notes 2025 and IB Chemistry data booklet reference are useful anchors.
A simple practice routine (that actually sticks)
Phase diagrams feel easy when you read them and hard when you’re timed. So build a loop:
-
Learn the definitions quickly (triple point, critical point, curves)
-
Do 10 targeted questions in the IB Chemistry Questionbank
-
Turn your mistakes into Flashcards (definition + one example)
-
Ask AI Chat to explain the one sentence you keep getting wrong
-
Re-sit a short timed set using Mock Exams or Predicted Papers
When you’re ready to simulate real pressure, run a full practice paper from Chemistry Predicted Papers. It’s the fastest way to learn which parts of IB Chemistry you can do calmly, and which parts you only understand when you’re relaxed.
Conclusion: treat the diagram like a decision map
Phase diagrams reward a calm kind of logic: find the region, name the boundary, state the condition.
If you can confidently explain the fusion, vaporisation, and sublimation curves, and define the triple point and critical point with clean IB Chemistry wording, you’ve already done most of the work.
To lock it in, build a short practice set in RevisionDojo’s Questionbank, summarise definitions using Flashcards, and use AI Chat when one confusing line keeps stealing your time. Then step up to Predicted Papers and Mock Exams for timed fluency.
That’s the difference between recognising a phase diagram and actually using it under exam conditions in IB Chemistry.