

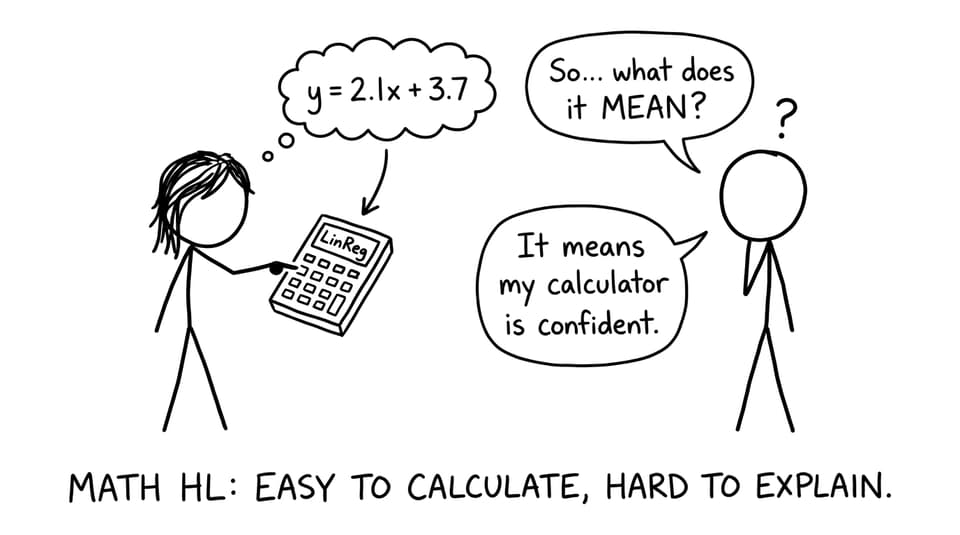
Linear regression is the kind of topic that makes you feel powerful for about ten seconds.
You type a few points into your calculator, press a button, and it hands you a neat equation like it was always there. In Math HL, that speed is the trap. Because the exam rarely asks, “Can you generate a regression line?” It asks, “Do you understand what you just generated?”
That’s why linear regression is easy to calculate but hard to explain in IB Maths: the calculation is a shortcut, but the explanation is a judgment call. And judgment is where marks quietly disappear.
A quick checklist for linear regression explanations (Math HL)
When a question asks you to interpret regression in Math HL, run this mental checklist before you write anything:
-
State the relationship using cautious language (association, not cause).
-
Interpret the gradient in context (variables + units).
-
Explain what the intercept means (and when it doesn’t).
-
Use the correlation coefficient correctly (strength and direction).
-
Comment on reliability: outliers, residuals, and whether extrapolation is happening.
If you want targeted practice on the exact wording IB expects, build short drills from the SL 4.10 regression line Questionbank and the SL 4.4 Pearson’s and scatter diagrams Questionbank.
What linear regression is actually doing (and what it isn’t)
In Math HL, it helps to think of regression as a compromise.
The regression line is the “best fit” straight line through the cloud of points, usually found by minimizing the overall squared vertical distances (residuals). That’s why it can look clean even when the data is messy: the method is designed to produce a line no matter what.
But IB cares that you treat the equation as a model, not a rule.
A model summarizes a pattern in the data you observed. It does not claim that the pattern must continue forever, and it does not explain why the pattern exists. If you want a quick refresher on the core stats language you need around modeling, keep Statistics and Probability notes open while you practice.
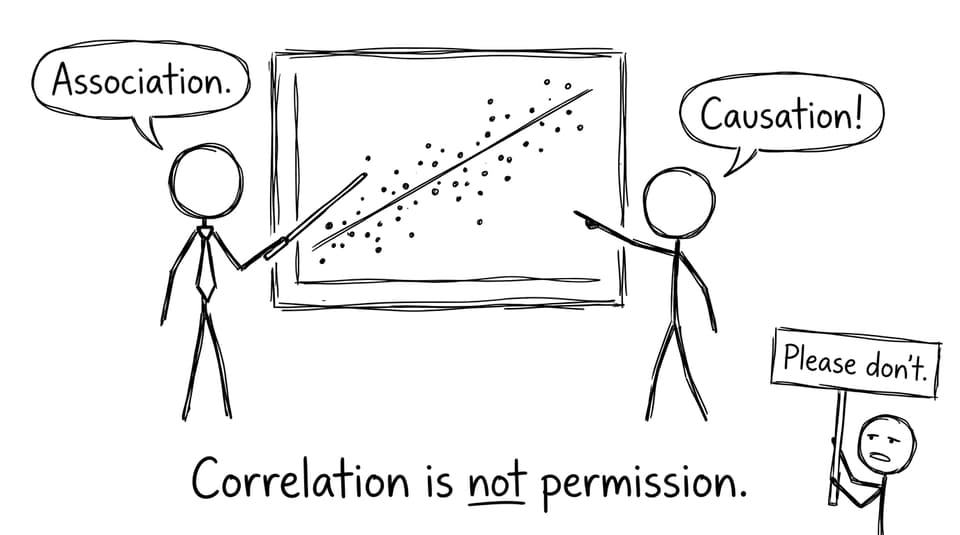
Why “correlation equals causation” loses marks so fast in Math HL
The regression line feels persuasive because it’s a single story: one variable goes up, the other tends to go up (or down). Under time pressure, many Math HL students slip into causal verbs: “leads to,” “results in,” “because of.”
IB examiners push back hard on that.
Regression shows association. It shows that two variables move together in the dataset you were given. It does not prove one variable causes the other. There could be a third factor driving both, or the relationship could break in a different setting or time period.
If you struggle with this, it often helps to train with examples and examiner-style phrasing. RevisionDojo’s Why strong correlations still lead to poor predictions is a useful mindset reset for Math HL explanations.
The gradient: simple in algebra, demanding in English
The slope (gradient) is mathematically straightforward: “change in y per 1 unit change in x.” The hard part in Math HL is translating that into a sentence that is specific, contextual, and careful.
A high-scoring gradient interpretation usually includes:
-
the variables by name (not just “x” and “y”)
-
the unit change in the explanatory variable
-
the average change in the response variable
-
the units
-
cautious language like “is predicted to” or “tends to”
A weak explanation sounds like a template. A strong one sounds like you are describing a real situation, even if the situation is fictional.
To tighten this quickly, do short practice sets, then use RevisionDojo AI Chat to check whether your interpretation is precise without becoming causal. Pair that with the Statistics & Probability Flashcards so your phrasing becomes automatic.
The correlation coefficient: what it tells you (and what it doesn’t)
In Math HL, students often treat a large |r| as a guarantee. But r is not a promise. It’s a description.
-
r tells you the strength and direction of a linear association.
-
r does not confirm that the regression model is “good enough” for prediction.
-
r does not mean the relationship is causal.
A common IB-style trap is when the correlation looks strong, but the scatter plot has an obvious curve or one influential outlier. That’s where residual thinking matters, even if the question doesn’t say “residual.”
For that deeper “fit versus meaning” distinction, RevisionDojo’s blog post Why residual analysis is more important than the regression equation is one of the cleanest explanations you can borrow for Math HL commentary.
Extrapolation: the silent mark-loss machine
In a timed exam, extrapolation feels efficient: you have an equation, so you plug in a value and move on. But IB wants you to notice when you’re predicting outside the range of your data.
That’s extrapolation, and it’s risky because the relationship might not hold beyond what you observed. Even when your calculation is correct, your conclusion can be judged as unreliable if you don’t mention the limitation.
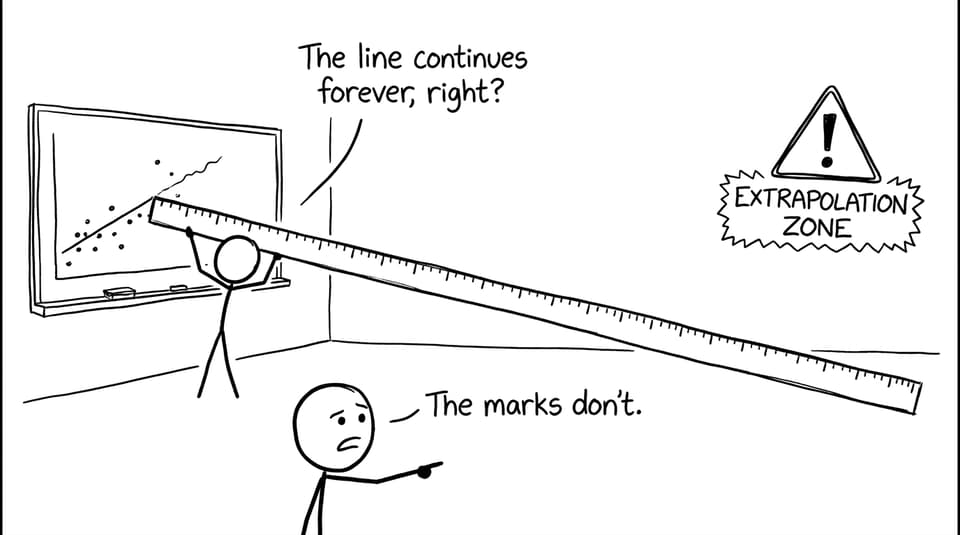
A good Math HL sentence looks like: “This is an extrapolation, so the prediction may be less reliable.” That one line can protect multiple marks.
How to practise regression explanations that score in Math HL
A practical loop that works:
-
Read the concept summary in Statistics & Probability.
-
Do 5--10 targeted questions in the regression Questionbank.
-
Use Grading tools to mark your written interpretation, not just the numeric answer.
-
Turn your weakest explanation into Flashcards (one card for “slope in context,” one for “r interpretation,” one for “extrapolation warning”).
-
Once a week, simulate pressure with Mock Exams or Predicted Papers like Math AA Predicted Papers.
RevisionDojo makes this smoother because the tools connect: Study Notes, Questionbank, Flashcards, AI Chat, Grading tools, Mock Exams, Predicted Papers, plus the Coursework Library and Tutors when you want feedback from a real person.
Conclusion: in Math HL, regression is a writing skill in disguise
Linear regression feels easy because the calculator does the heavy lifting. But in Math HL, the real test is whether you can explain what the line suggests, what r supports, and where the model stops being trustworthy.
If regression explanations are costing you marks, treat them like a language you can rehearse. Use RevisionDojo’s Statistics & Probability notes, drill with the Questionbank, and sharpen phrasing with AI Chat until your interpretations sound calm, specific, and examiner-proof. That’s how you turn “easy to calculate” into “easy to score.”