


In the week before mocks, markets start appearing everywhere.
A friend offers to sell you their calculator. Someone else buys the last revision guide in the library. Suddenly you are watching prices move in real time, not because a teacher told them to, but because people are reacting to pressure.
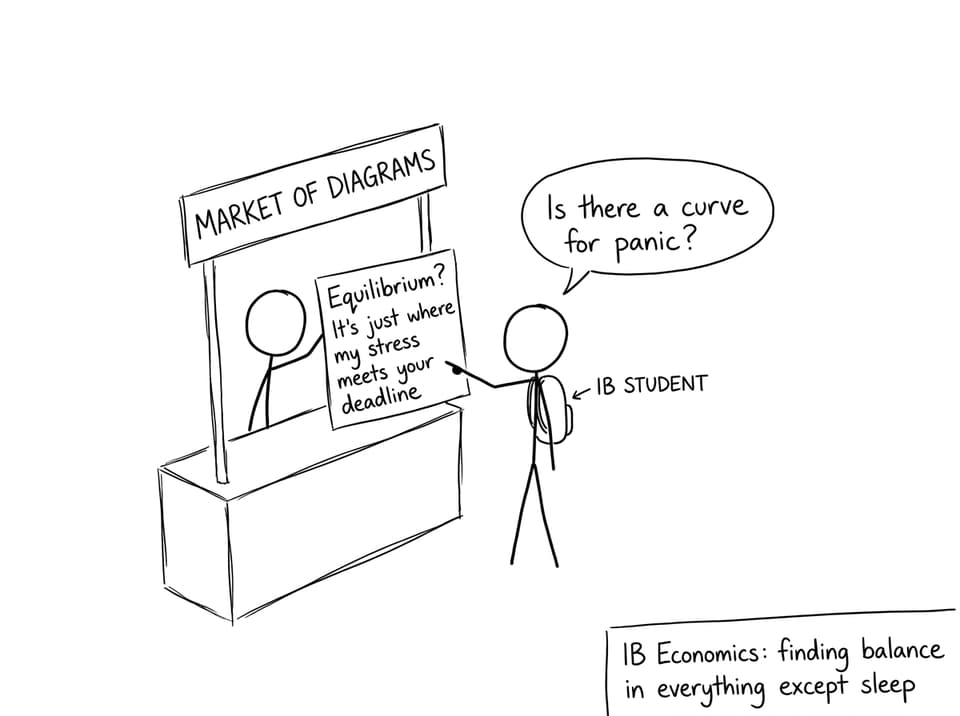
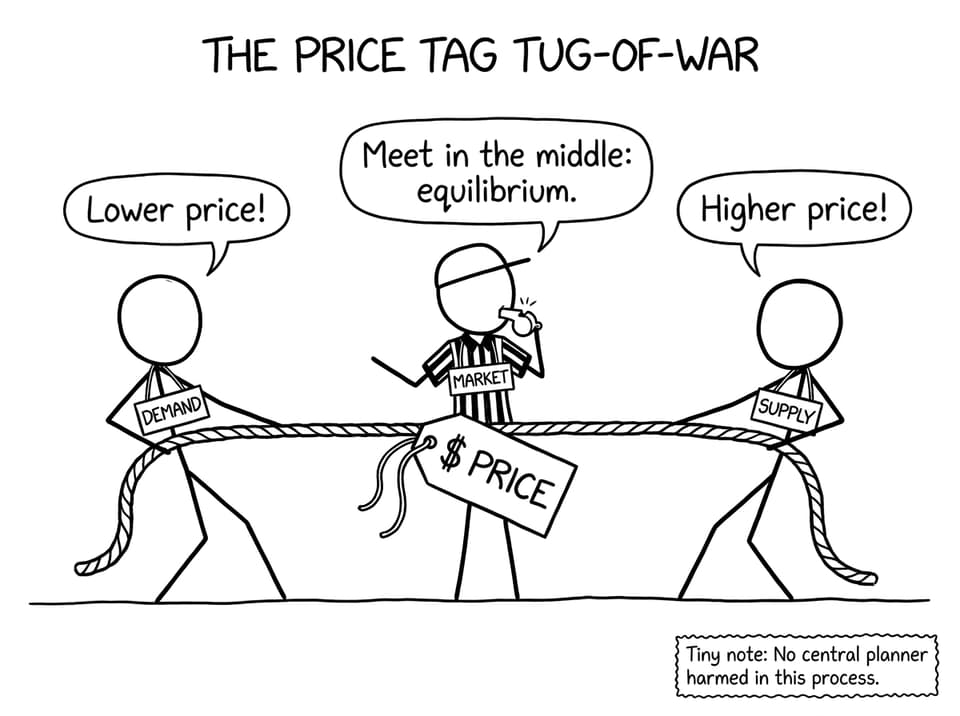
That is the heart of IB Economics: the quiet, constant negotiation between what buyers want and what sellers can provide. When those two forces settle into balance, you get equilibrium price.
What equilibrium price means in IB Economics
In IB Economics, equilibrium price is the price level where quantity demanded equals quantity supplied. On a demand and supply diagram, it is the point where the demand curve (D) intersects the supply curve (S).
If you want a fast exam checklist, remember these three lines:
-
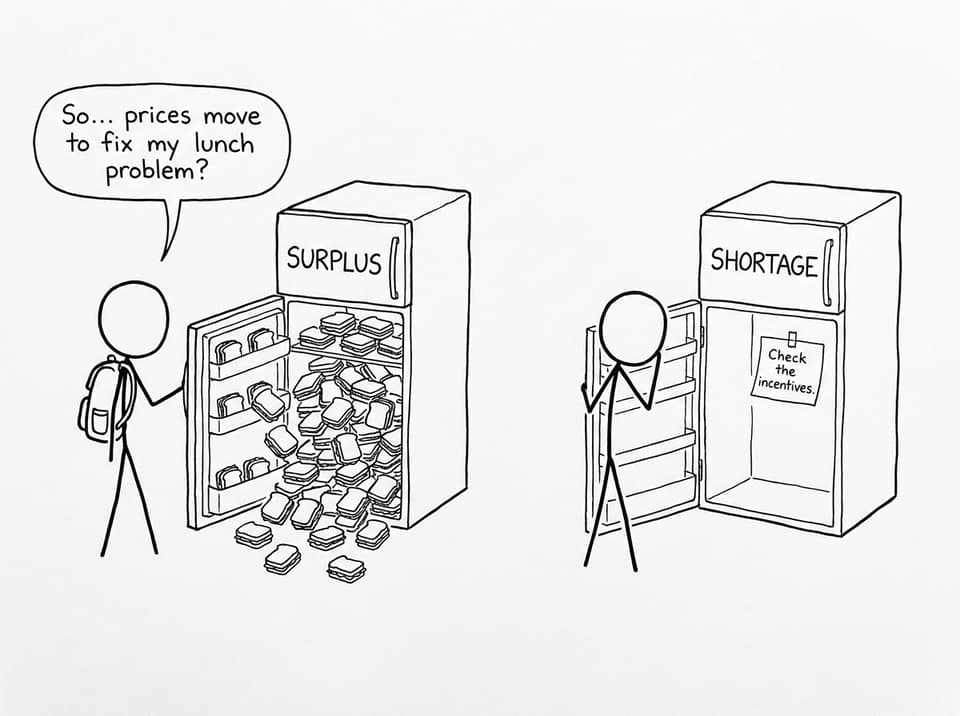
If price is above equilibrium, you get a surplus (excess supply).
-
If price is below equilibrium, you get a shortage (excess demand).
-
Surpluses push prices down; shortages push prices up.
To tighten your definitions and diagram language, pair this article with RevisionDojo’s topic hub for IB Economics Resources and the focused syllabus page on Demand and supply curves forming a market equilibrium.
How supply and demand interact to reach equilibrium price
In IB Economics, the interaction is a process, not a magic dot on a graph.
When the price is too high: surplus and downward pressure
Imagine the market price is set above equilibrium. At that price:
-
Firms are willing to supply a lot (higher profit incentive).
-
Consumers are willing to buy less (it feels expensive).
So quantity supplied > quantity demanded. That surplus is not abstract. It is unsold stock, discount signs, and firms quietly lowering prices to clear inventory. As price falls, quantity demanded rises and quantity supplied contracts until the gap disappears. Equilibrium price is where the market stops “pulling” itself back.
For a clean definition refresh on the curves themselves, use Define Supply and Demand and the study notes on Demand.
When the price is too low: shortage and upward pressure
Now flip it. If the market price is set below equilibrium:
-
Consumers want to buy more (it feels cheap).
-
Firms supply less (lower incentive).
So quantity demanded > quantity supplied. That shortage creates competition among buyers. Some are willing to pay more, sellers notice, and price rises. Higher prices ration the good and encourage firms to supply more, again pushing the market back toward equilibrium price.
If you want to connect this story to IB language, the notes on Functions of the price mechanism are gold for Paper 1 explanations.
Why equilibrium in IB Economics is self-correcting
The reason equilibrium price forms without a central planner is incentives.
-
Consumers respond to higher prices by buying less or switching to substitutes.
-
Producers respond to higher prices by expanding output or entering the market.
This feedback loop is the “price mechanism” working in the background. In IB Economics, examiners reward students who explain the logic of adjustment, not just the final equilibrium.
To practise writing that logic under time pressure, RevisionDojo’s Microeconomics Questionbank is built for exam-style responses with fast feedback. Pair it with the Competitive market equilibrium topic page to revise the exact syllabus scope.
What shifts equilibrium price (and what stays the same)
Equilibrium price changes when a non-price determinant shifts demand or supply.
-
Demand shifts right (higher income, stronger tastes, more buyers) -> equilibrium price rises and equilibrium quantity rises.
-
Supply shifts right (better technology, lower input costs, subsidies) -> equilibrium price falls and equilibrium quantity rises.
That is why equilibrium in IB Economics is best seen as “today’s balance.” Tomorrow’s balance can move.
For supply-side drivers and diagram phrasing, use the Supply notes. If you are extending to government intervention essays, the notes on Tax incidence and price elasticity help you discuss how elasticities change the outcomes.
Quick exam mini-checklist (diagram + explanation)
-
Label axes: Price (P) and Quantity (Q).
-
Draw D downward, S upward.
-
Mark intersection as (Pe, Qe).
-
If price is above Pe: label surplus and show price falling.
-
If price is below Pe: label shortage and show price rising.
Closing: turn equilibrium into exam marks
Equilibrium price is the calm point where supply and demand stop arguing. In IB Economics, your job is to show how the argument happens: surplus pushes price down, shortage pushes price up, and shifts rewrite the balance.
If you want this to feel automatic under exam time limits, use RevisionDojo as your home base: build speed with the Questionbank, lock in definitions with Study Notes and Flashcards, test your diagrams with AI Chat and Grading tools, and sharpen timing with Predicted Papers and Mock Exams. When equilibrium price shows up in a prompt, you will not just remember it; you will explain it clearly.