


The moment you realize price isn’t random
In IB Economics, supply and demand can feel like a polite story your teacher tells until you meet your first tricky diagram question. Then it clicks: prices aren’t numbers that appear from nowhere. They’re the quiet outcome of thousands of decisions made by tired students buying coffee, firms chasing profit, and everyone responding to incentives.
That’s why IB Economics microeconomics starts here. If you can define supply and demand cleanly, and show equilibrium with confidence, you unlock a huge chunk of Paper 1 explanation and Paper 3 calculations.
Quick exam checklist (use this before you draw)
For IB Economics supply and demand questions, make sure you can do these fast:
-
Define demand and supply using “willing and able” language
-
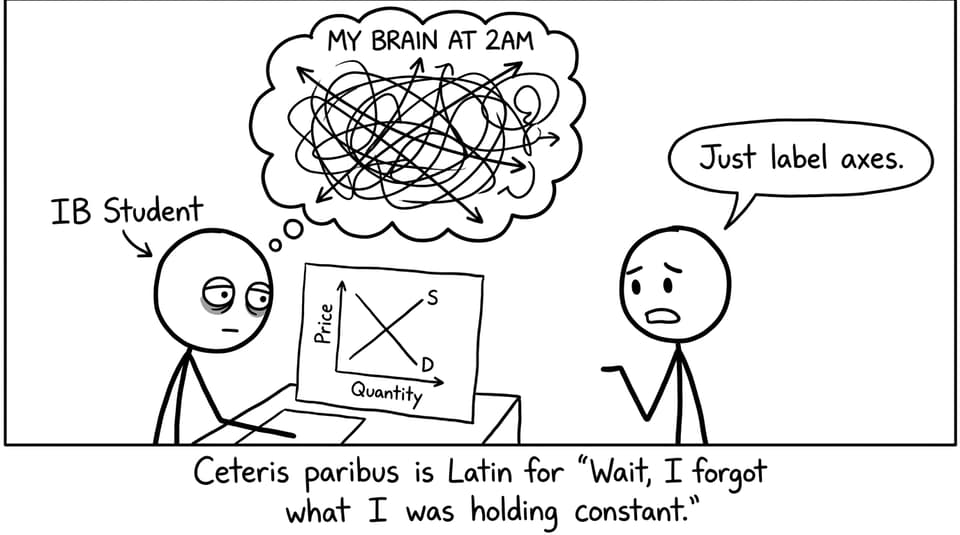
State the law of demand and law of supply with ceteris paribus
-
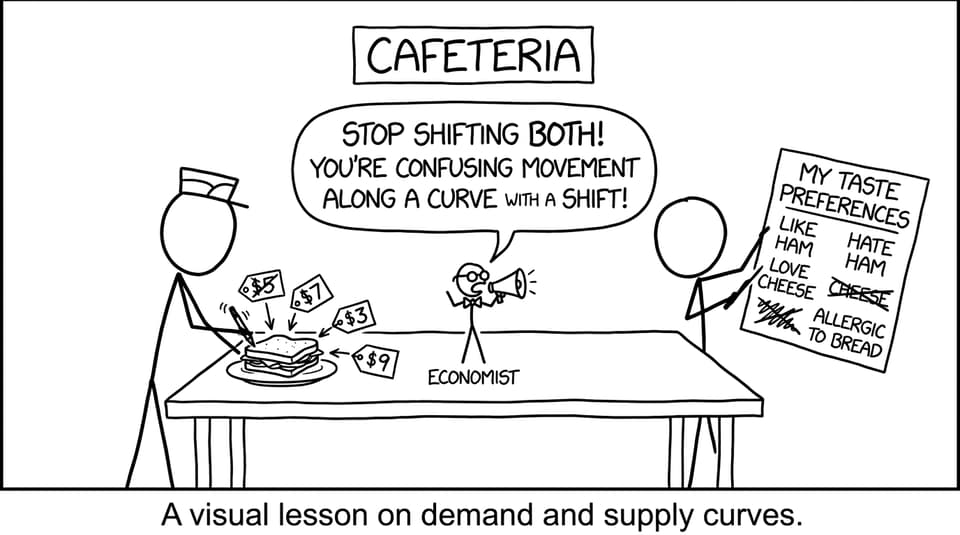
Explain a movement along a curve vs a shift of the curve
-
Identify equilibrium price and equilibrium quantity
-
Use the words shortage (excess demand) and surplus (excess supply) correctly
If you want the syllabus-aligned version with diagrams and practice, start with RevisionDojo’s IB Economics hub and the Microeconomics overview.
Define demand in IB Economics (and why it slopes down)
In IB Economics, demand is the quantity of a good or service that consumers are willing and able to buy at different prices over a given time period.
The law of demand says that, ceteris paribus, when price falls, quantity demanded rises (and when price rises, quantity demanded falls).
The intuition is simple, and examiners like when you name the mechanisms:
-
Substitution effect: when a product becomes cheaper, people switch toward it from alternatives.
-
Income effect: lower price increases real purchasing power.
-
Diminishing marginal utility: extra units are less satisfying, so consumers need a lower price to buy more.
Non-price determinants that shift demand
In IB Economics, a shift means demand changes at every price. Common shifters include income, tastes, substitutes/complements, population, and expectations. A rightward shift is higher demand; a leftward shift is lower demand.
Define supply in IB Economics (and why it slopes up)
In IB Economics, supply is the quantity of a good or service that producers are willing and able to sell at different prices over a given time period.
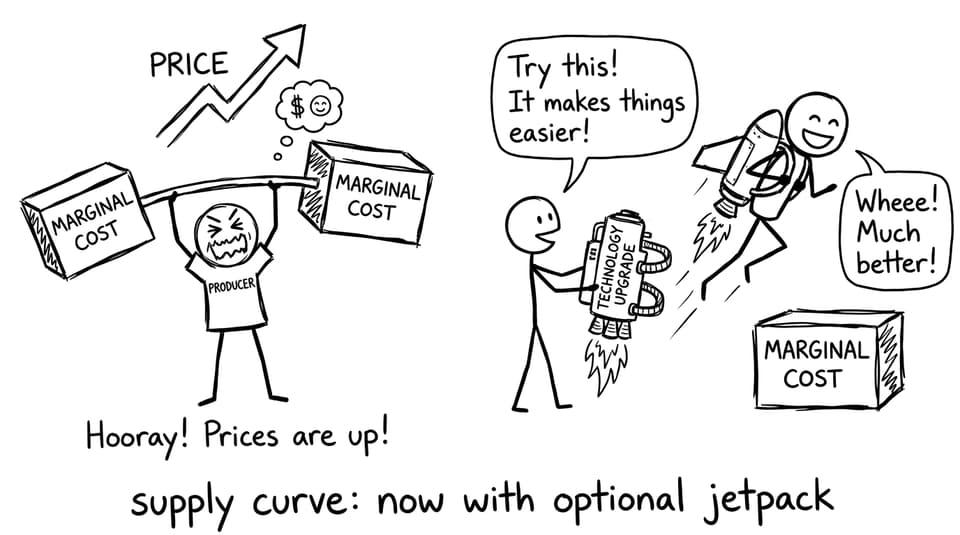
The law of supply says that, ceteris paribus, higher prices lead to higher quantity supplied, because production becomes more profitable and firms can justify rising marginal costs.
For a diagram refresher, RevisionDojo’s Supply curve notes are a quick win.
Non-price determinants that shift supply
Supply shifts when costs or conditions change, such as:
-
Input costs (wages, energy, raw materials)
-
Technology
-
Taxes and subsidies
-
Expectations
-
Number of firms
To connect this to market-wide outcomes, see Market supply notes.
Market equilibrium: where the curves agree
In IB Economics, market equilibrium occurs where quantity demanded equals quantity supplied. That intersection sets:
-
Equilibrium price (Pe)
-
Equilibrium quantity (Qe)
If price is above equilibrium, quantity supplied exceeds quantity demanded: a surplus (excess supply). If price is below equilibrium, quantity demanded exceeds quantity supplied: a shortage (excess demand).
Build your explanation around the price mechanism: price changes signal and incentivize buyers and sellers. RevisionDojo covers this cleanly in Functions of the price mechanism and expands equilibrium logic in Market equilibrium guide.
How to turn definitions into marks
A small pattern helps in IB Economics: definitions earn you entry, diagrams earn you structure, and reasoning earns you the top bands.
Try this 3-line approach:
-
Define demand/supply and state the law with ceteris paribus.
-
Say whether it’s a movement along or a shift and why.
-
Conclude with equilibrium changes (Pe and Qe) plus shortage/surplus if relevant.
Then practise with exam-style prompts using RevisionDojo’s tools: the Questionbank for targeted drills, Study Notes for tight definitions, Flashcards for shifters, AI Chat to test your explanation, and Grading tools to check essay clarity. When you need realistic timed pressure, use Predicted Papers and Mock Exams. If coursework examples help your real-world evaluation, the Coursework Library and Tutors can support your IA-style thinking.
For extra depth after equilibrium, Consumer and producer surplus notes connect the same diagram to welfare analysis.
Final takeaway: make the diagram feel inevitable
The goal in IB Economics isn’t to memorise two curves. It’s to make the outcome feel inevitable: choices meet constraints, incentives do the rest, and equilibrium is the quiet compromise.
If you want to lock this in quickly, revise the definitions with Demand and supply equilibrium notes, then test yourself with RevisionDojo’s Questionbank, refine with AI Chat, and finish with Mock Exams and Predicted Papers for exam-level timing.