LogoLogo
    Logo
    • TutoringSchools
    1. Home
    2. IB
    3. Biology
    4. Questions

    An experiment was carried out on osmosis in carrot (Daucus carota) root tissue and potato (Solanum tuberosum) tuber tissue. Similar sized pieces of tissue were cut and soaked in different sucrose solutions for 24 hours. The results are shown in the graph below.

    Question
    SLPaper 3

    An experiment was carried out on osmosis in carrot (Daucus carota) root tissue and potato (Solanum tuberosum) tuber tissue. Similar sized pieces of tissue were cut and soaked in different sucrose solutions for 24 hours. The results are shown in the graph below.

    1.

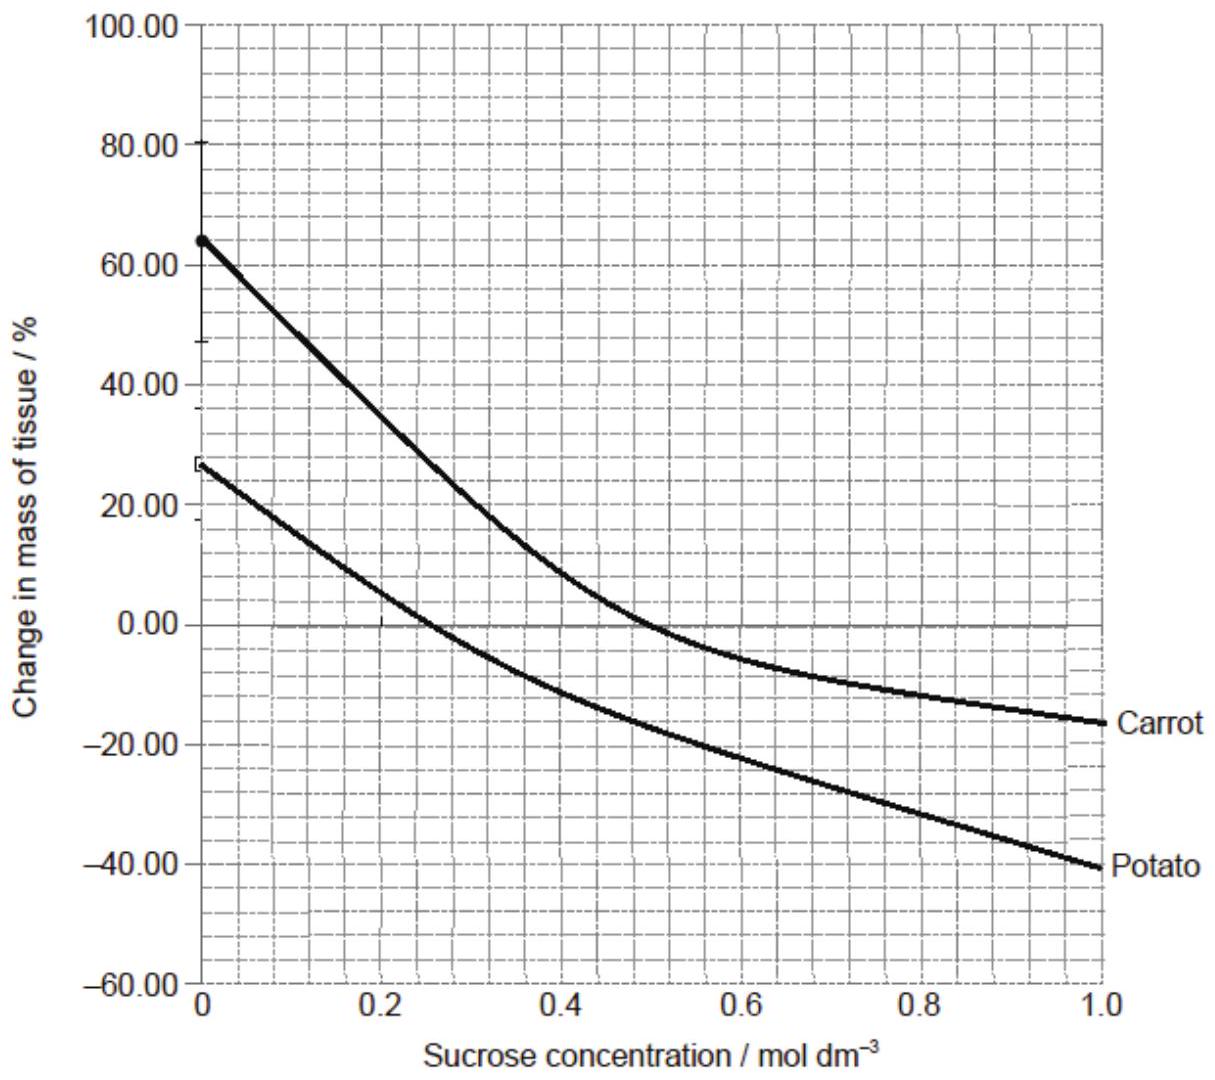
    Using the graph, estimate isotonic sucrose solutions for potato tissue and carrot tissue.

    [2]
    Verified
    Solution

    potato: 0.26 moldm−3✓0.26 \mathrm{~mol} \mathrm{dm}^{-3} \checkmark0.26 moldm−3✓ carrot: 0.50 moldm−3✓0.50 \mathrm{~mol} \mathrm{dm}^{-3} \checkmark0.50 moldm−3✓

    Allow a range of 0.22−0.320.22-0.320.22−0.32 Allow a range of 0.45−0.550.45-0.550.45−0.55 (Allow 1 max if no units or either unit is omitted)

    2.

    Suggest a reason for the difference in the isotonic points for the potato and the carrot tissues.

    [1]
    Verified
    Solution

    different dissolved solutes/sugars/sucrose/salts/molarities ✓\checkmark✓ OR may have been grown in different soils giving their tissues different contents ✓\checkmark✓ OR may have been stored under different conditions ✓\checkmark✓ OR may be more dehydrated / different water content ✓\checkmark✓ OR different types of tissue / different age ✓\checkmark✓

    Do not accept starch.

    3.

    From the evidence provided by the graph, evaluate the reliability of these data.

    [2]
    Verified
    Solution

    a. the data show clear trends OR a trend line could be drawn through these data OR there are no outliers ✓\checkmark✓

    b. the error bars/standard deviations shown OR the error bars/standard deviations vary with concentration ✓\checkmark✓

    c. sample size is unknown ✓\checkmark✓

    4.

    Explain one reason for calculating the percentage change in mass.

    [2]
    Verified
    Solution

    a. the change in mass indicates whether the tissue has gained/lost water ✓\checkmark✓

    b. the pieces of tissue will not be the same mass «at the beginning of the experiment» ✓\checkmark✓

    c. to compare the relative changes in mass ✓\checkmark✓

    Sign up for free to view this answer

    Still stuck?

    Get step-by-step solutions with Jojo AI

    FreeJojo AI

    Want more practice questions for Biology?

    Related topics


    Join 350k+ students using RevisionDojo today

    Footer

    General

    • About us
    • Mission
    • Tutoring
    • Blog
    • State of learning surveyNew

    • Content philosophy
    • Content manifesto
    • Trustpilot
    • Contact us
    • Join us We're hiring!

    Features

    • Jojo AI
    • Questionbank
    • Study notes
    • Flashcards
    • Test builder
    • Exam mode
    • Coursework
    • IB grade calculator

    Legal

    • Terms and conditions
    • Privacy policy
    • Cookie policy
    • Trust Center

    IB

    • Biology (New syllabus)
    • Business Management
    • Chemistry (New syllabus)
    • Chinese A Lang & Lit
    • Chinese B
    • Computer Science (CS)
    • Design Technology (DT)
    • Digital Society (DS)
    • Economics
    • English B
    • View more...
    Logo

    © 2022 - 2025 RevisionDojo (MyDojo Inc)

    RevisionDojo was developed independently of the IBO and as such is not endorsed by it in any way.

    SAT® is a trademark registered and owned by the College Board®, which is not affiliated with and does not endorse this product or site.

    RedditInstagramTikTokDiscord
    GDPR compliant