
Firm A, which is operating in a perfectly competitive market, produces almonds. Figure 1 illustrates Firm A’s average total cost (ATC), average variable cost (AVC) and marginal cost (MC) curves at different output levels.

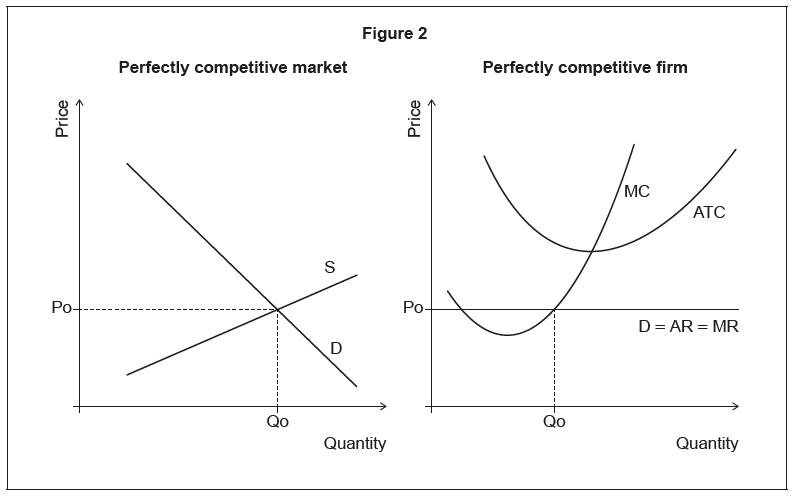
Figure 2 illustrates a perfectly competitive market in equilibrium and a perfectly competitive firm operating in this market. S is supply, D is demand, Po is the short-run equilibrium price, Qo is the short-run equilibrium quantity, MC is marginal cost, ATC is average total cost, AR is average revenue, MR is marginal revenue.
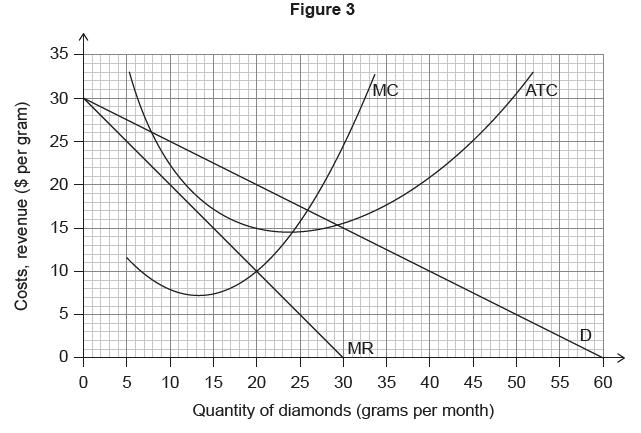
Firm B is a monopoly producer of diamonds. Figure 3 illustrates its demand (D), marginal revenue (MR), average total cost (ATC) and marginal cost (MC) curves at different output levels.
The market for shampoo displays the characteristics of monopolistic competition.
Using information from Figure 1, calculate Firm A’s total fixed costs.
| Description | Marks |
|---|---|
| The work does not reach a standard described by the descriptors below. | 0 |
| The response indicates little understanding of the specific demands of the question. Economic theory is stated but is not relevant. Economic terms are stated but are not relevant. No evidence of synthesis or evaluation. A real-world example(s) is identified but is irrelevant. | 0 |
| The response indicates some understanding of the specific demands of the question. Relevant economic theory is described. Some relevant economic terms are included. Evidence of superficial synthesis or evaluation. A relevant real-world example(s) is identified. | 1 |
| The specific demands of the question are understood and addressed. Relevant economic theory is explained. Relevant economic terms are mostly used appropriately. Relevant diagram(s) are included and explained where appropriate. Evidence of appropriate synthesis or evaluation that is mostly balanced. A relevant real-world example(s) is identified and developed in context. | 2 |
Markscheme for Calculating Total Fixed Costs:
-
Correct Calculation with Valid Working (2 marks):
- The candidate correctly calculates the total fixed costs using the formula: .
- Example: Using the output level of 20 units, the calculation is .
- Any valid working from another output level, such as 30 units , is sufficient for 2 marks.
-
Allowance for Tolerance (2 marks):
- Allow a tolerance of ±370 to $390, for the final answer.
- Responses that lie outside the ± 45 \times (31 - 23) = 360 $) may be fully rewarded.
-
Answer Without Working (1 mark):
- An answer of $380 or 380 without workings is sufficient for 1 mark.
-
Units and Presentation (1 mark):
- For full marks to be awarded, the response must provide valid working and include correct units. However, superfluous units (e.g., $380 per kg) may be ignored.
Examples for Examiners:
- If a candidate uses the output level of 20 units and calculates , award full marks if the working is shown and units are correct.
- If a candidate provides an answer of $380 without showing working, award 1 mark.
- If a candidate calculates using a different output level, such as 30 units, and provides , award full marks if within the tolerance range and working is shown.
- If a candidate provides an answer outside the tolerance range but shows understanding of the relationship between ATC and AVC, consider awarding marks based on the explanation provided.
The market price of almonds is $11 per kilogram. Using Figure 1, identify the quantity of almonds Firm A must produce in order to maximize profits.
| Description | Marks |
|---|---|
| The candidate correctly identifies the profit-maximizing output level for Firm A as 21 kg, using the intersection of the marginal cost (MC) and marginal revenue (MR) curves as the basis for their answer. The response includes a detailed explanation of why this point is the profit-maximizing level, referencing the economic theory that in perfect competition, firms maximize profit where MC = MR. The candidate should also mention that at this point, the price is equal to the marginal cost, which is a characteristic of perfect competition. An example of a real-world perfectly competitive market, such as the agricultural market for wheat, should be included to illustrate the concept. | 1 |
| The candidate fails to identify the correct output level or provides an incorrect explanation of the economic theory. The response does not demonstrate an understanding of the relationship between MC, MR, and profit maximization. No relevant real-world example is provided. | 0 |
Calculate the economic profit/loss when Firm A is producing at the output level identified in part (b)(i).
New Markscheme for Calculating Economic Profit/Loss
Marks Allocation:
-
0 Marks: The response does not reach a standard described by the descriptors below.
-
1 Mark: The response indicates little understanding of the specific demands of the question. Economic theory is stated but is not relevant. Economic terms are stated but are not relevant. No evidence of synthesis or evaluation. A real-world example(s) is identified but is irrelevant.
- Example: The student states that Firm A is making a loss but does not provide any calculations or relevant economic theory.
-
2 Marks: The response indicates understanding of the specific demands of the question. Relevant economic theory is described and applied correctly. The calculation of economic profit/loss is accurate and includes correct units. A relevant diagram is included and labeled correctly.
- Example: The student calculates the economic loss using the formula Economic Loss = (Price - ATC) x Quantity, provides a correct numerical answer, and includes a diagram showing the ATC and price at the given output level, clearly indicating the area of loss.
Specific Instructions for Examiners:
-
Valid Working: For full marks, the response must provide valid working and include correct units. Superfluous units may be ignored.
- Example Calculation: Economic Loss = (Price - ATC) x Quantity
-
OFR (Own Figure Rule): Applies if an incorrect quantity is given for part (b)(i), but the subsequent calculation is consistent with this quantity.
-
Units: An answer of a loss of $357 or −357 without workings is sufficient for [1] mark, but full marks require correct units and valid working.
-
Diagrams: Diagrams should be used to illustrate the economic loss and must be labeled correctly to achieve higher marks.
Based on the information in Figure 2, state whether the firms in this market are making normal profits, economic profits or economic losses.
| Description | Marks |
|---|---|
| The response states that firms in the market are making economic losses, with no further explanation or incorrect reasoning. | 0 |
| The response correctly identifies that firms are making economic losses and provides a brief explanation, such as noting that price is below average total cost (ATC) at the equilibrium quantity. | 1 |
Examples:
- A response scoring 0 marks might simply state "economic losses" without further detail or provide incorrect reasoning.
- A response scoring 1 mark might state "Firms are making economic losses because the price is below ATC at the equilibrium quantity, as shown in Figure 2."
On Figure 2, draw and label appropriate additional curves to show how a perfectly competitive market will move from short-run equilibrium to long-run equilibrium.
Revised Markscheme for Drawing and Labelling Diagrams in Perfect Competition
-
[0 Marks]: No attempt or completely incorrect diagrams.
-
[1 Mark]:
- One diagram is drawn with some correct elements but lacks clarity or accuracy in labelling.
- Example: A diagram with an MC curve intersecting the ATC curve but missing labels for equilibrium price or quantity.
- One diagram is drawn with some correct elements but lacks clarity or accuracy in labelling.
-
[2 Marks]:
- Two diagrams are drawn and mostly labelled correctly, showing a clear understanding of the transition from short-run to long-run equilibrium.
- Example: Market diagram showing supply and demand curves with both short-run and long-run equilibrium prices and quantities labelled, and firm diagram showing MC, ATC, AR, and MR curves with the firm's equilibrium output where MC=MR labelled.
- Two diagrams are drawn and mostly labelled correctly, showing a clear understanding of the transition from short-run to long-run equilibrium.
Additional Notes for Examiners:
- The firm’s new quantity (Q) in the long-run equilibrium need not be specified on the diagram, but the transition from short-run to long-run should be clear.
- Titles are not required for the diagrams, but clarity in labelling is essential.
- For the firm’s model, D1 or AR1 or MR1 is sufficient; P1 is not required.
- Ensure that the diagrams reflect the movement from short-run to long-run equilibrium, showing adjustments in supply and demand or cost curves as necessary.
- Encourage candidates to use real-world examples to illustrate the transition from short-run to long-run equilibrium, such as changes in market conditions or firm entry/exit in the industry.
Using your answer to part (c)(ii), explain how the market adjustment takes place.
| Description | Marks |
|---|---|
| The work does not reach a standard described by the descriptors below. | 0 |
| The response indicates little understanding of the specific demands of the question. Economic theory is stated but is not relevant. Economic terms are stated but are not relevant. No evidence of synthesis or evaluation. A real-world example(s) is identified but is irrelevant. | 0.5 |
| The response indicates some understanding of the specific demands of the question. Relevant economic theory is described. Some relevant economic terms are included. Evidence of superficial synthesis or evaluation. A relevant real-world example(s) is identified. | 1 |
| The response indicates understanding of the specific demands of the question, but these demands are only partially addressed. Relevant economic theory is partly explained. Some relevant economic terms are used appropriately. Relevant diagram(s) are included where appropriate. Evidence of appropriate synthesis or evaluation but lacks balance. A relevant real-world example(s) is identified and partly developed in context. | 1.5 |
| The specific demands of the question are understood and addressed. Relevant economic theory is explained. Relevant economic terms are mostly used appropriately. Relevant diagram(s) are included and explained where appropriate. Evidence of appropriate synthesis or evaluation that is mostly balanced. A relevant real-world example(s) is identified and developed in context. | 2 |
Examples for each level:
-
0.5 Marks: The student might mention that firms in a perfectly competitive market are price takers but fail to connect this to the market adjustment process. They might identify a real-world example like the wheat market but not explain its relevance.
-
1 Mark: The student describes that in a perfectly competitive market, firms will enter or exit the market based on profit levels, but the explanation lacks depth. They might mention a relevant example such as the agricultural sector but provide limited context.
-
1.5 Marks: The student explains that in a perfectly competitive market, if firms are making supernormal profits, new firms will enter, increasing supply and driving down prices until only normal profits are made. They might use a diagram to show this adjustment but not fully explain it. An example like the dairy industry might be mentioned with some context.
-
2 Marks: The student provides a clear explanation of the market adjustment process in a perfectly competitive market, using diagrams to illustrate how entry and exit of firms affect supply and prices. They might discuss the role of normal profits in the long run and use a well-developed example such as the coffee market.
State two assumed characteristics of a monopoly.
| Description | Marks |
|---|---|
| The response does not identify any characteristics of a monopoly. | 0 |
| The response identifies one characteristic of a monopoly but lacks explanation or example. | 1 |
| The response identifies one characteristic of a monopoly with a basic explanation or example. | 2 |
| The response identifies two characteristics of a monopoly but lacks explanation or examples. | 3 |
| The response identifies two characteristics of a monopoly with basic explanations or examples. | 4 |
| The response identifies two characteristics of a monopoly with clear explanations and relevant examples. | 5 |
Revised Markscheme for Stating Two Assumed Characteristics of a Monopoly
-
Single or Dominant Firm in the Market:
- Identification (1 mark): Recognize that a monopoly exists when there is only one firm that dominates the entire market.
- Explanation (1 mark): Explain how this characteristic allows the firm to have significant control over the market supply and influence prices.
- Example (1 mark): Provide a real-world example, such as a local utility company that is the sole provider of electricity in a region, illustrating the firm's market dominance.
-
No Close Substitutes:
- Identification (1 mark): Identify that a monopoly has no close substitutes for its product.
- Explanation (1 mark): Explain how the lack of close substitutes limits consumer alternatives and reinforces the monopoly's market power.
- Example (1 mark): Use an example like De Beers in the diamond industry, which historically had no close substitutes for its diamonds, allowing it to maintain control over prices.
Note: Accept any other valid characteristic that accurately describes a monopoly, such as significant barriers to entry, control over a key resource, or government regulation that limits competition. Ensure that examples provided are relevant and illustrate the characteristic effectively. Each characteristic should be clearly identified, explained, and supported with a relevant example to achieve full marks.
Explain two reasons why a monopoly may be considered desirable for an economy.
| Marks | Descriptor |
|---|---|
| 0 | The response does not meet the criteria for any of the descriptors below. |
| 1 | The response shows minimal understanding of why a monopoly might be desirable. Economic theory is mentioned but not linked to the question. Terms like 'monopoly' or 'economies of scale' might be used incorrectly. No synthesis or evaluation is present. An example, such as a government-granted monopoly, is mentioned but not relevant. |
| 2 | The response shows limited understanding of the question. Some economic theory related to monopolies is mentioned, such as potential for economies of scale, but lacks clarity. Terms are occasionally used correctly. An example, like a utility company, is mentioned but not explained. |
| 3 | The response shows some understanding of the question. Basic economic theory related to monopolies is described, such as potential for economies of scale or innovation due to higher profits. Some terms are used correctly. There is superficial synthesis or evaluation. A relevant example, like a utility company, is identified but not well developed. |
| 4 | The response shows a good understanding of the question. Economic theory is partly explained, such as how monopolies can lead to economies of scale or fund research and development. Some terms are used appropriately. Diagrams, if included, are relevant but not fully explained. There is some synthesis or evaluation, though it may lack depth. An example, such as a pharmaceutical company, is identified and partly developed. |
Using Figure 3, calculate the economic profit when Firm B is maximizing its profits.
| Description | Marks |
|---|---|
| The work does not reach a standard described by the descriptors below. | 0 |
| The response indicates little understanding of the specific demands of the question. The identification of the profit maximization point is incorrect or missing. No relevant calculations are provided. | 1 |
| The response indicates some understanding of the specific demands of the question. The profit maximization point is identified, but calculations for total revenue or total cost are incorrect or incomplete. | 2 |
Markscheme for Calculating Economic Profit for Firm B (Monopoly):
-
Identifying Profit Maximization Point:
- Correctly identify the output level where MR = MC on Figure 3. [0.5 mark]
- Correctly identify the price level from the demand curve at this output. [0.5 mark]
- Example: If MR and MC intersect at a quantity of 10 units, and the corresponding price on the demand curve is $25, these should be identified.
-
Calculating Total Revenue (TR):
- Use the formula TR = Price x Quantity. [0.5 mark]
- Example: If the price is 25 x 10 = $250.
-
Calculating Total Cost (TC):
- Use the formula TC = ATC x Quantity. [0.5 mark]
- Example: If ATC is 18 x 10 = $180.
-
Calculating Economic Profit:
- Use the formula Economic Profit = TR - TC. [0.5 mark]
- Example: Economic Profit = 180 = $70.
-
Units and Presentation:
- Ensure the final answer includes correct units (e.g., dollars). [0.5 mark]
- An answer of $70 or 70 without workings is sufficient for [0.5 mark].
-
Consideration of "Per Unit" Terms:
- Answers that include "per unit" may be accepted if the context is clear. [0.5 mark]
Note: For full marks, the response must provide valid working and include correct units. Partial credit may be awarded for correct steps even if the final answer is incorrect.
Using Figure 3, calculate the total revenue when Firm B is maximizing its revenue.
New Markscheme for Calculating Total Revenue in a Monopoly
| Description | Marks |
|---|---|
| The response does not meet the criteria for the descriptors below. | 0 |
| The response shows a basic attempt to calculate total revenue but lacks accuracy or relevance. There is no use of economic terms or diagrams. | 1 |
| The response correctly calculates total revenue using the formula: Total Revenue = Price × Quantity, but lacks units or context. | 2 |
Detailed Marking Instructions:
-
Correct Calculation
- Award 1 mark for correctly calculating total revenue using the formula: Total Revenue = Price × Quantity.
- Example: If the price is 450.
-
Inclusion of Units
- Award 1 mark for including correct units in the answer.
- Example: Total Revenue = $450.
-
Application to Firm B's Context
- Although not required for full marks, responses that apply the calculation to Firm B's monopoly context, explaining how the revenue-maximizing output is determined from the MR=0 condition, can demonstrate deeper understanding.
- Example: Identifying the output level where MR=0 and calculating the corresponding total revenue.
-
Use of Diagrams
- While not necessary for full marks, the inclusion and explanation of relevant diagrams, such as the demand and MR curves, can enhance the response.
- Example: Annotating the diagram to show the revenue-maximizing point and corresponding price and quantity.
-
Real-World Example
- Integration of a real-world example is not required for full marks but can provide additional context and depth.
- Example: Discussing a real-world monopoly and how it determines its revenue-maximizing output.
A shampoo firm is earning economic profits. Outline, with a reason, what will happen to its demand curve in the long run.
| Description | Marks |
|---|---|
| The work does not reach a standard described by the descriptors below. | 0 |
| The response indicates little understanding of the specific demands of the question. Economic theory is stated but is not relevant. Economic terms are stated but are not relevant. No evidence of synthesis or evaluation. A real-world example(s) is identified but is irrelevant. | 0–1 |
| The response indicates some understanding of the specific demands of the question. Relevant economic theory is described. Some relevant economic terms are included. Evidence of superficial synthesis or evaluation. A relevant real-world example(s) is identified. | 1 |
| The response indicates understanding of the specific demands of the question, but these demands are only partially addressed. Relevant economic theory is partly explained. Some relevant economic terms are used appropriately. Relevant diagram(s) are included where appropriate. Evidence of appropriate synthesis or evaluation but lacks balance. A relevant real-world example(s) is identified and partly developed in context. | 1–2 |
| The specific demands of the question are understood and addressed. Relevant economic theory is explained. Relevant economic terms are mostly used appropriately. Relevant diagram(s) are included and explained where appropriate. Evidence of appropriate synthesis or evaluation that is mostly balanced. A relevant real-world example(s) is identified and developed in context. | 2 |
Specific Examples for Each Mark Band:
-
0–1 Marks:
- The student might mention that the demand curve will shift but fails to explain why or how it relates to economic profits in monopolistic competition.
- Example: "The demand curve will change because the firm is making profits."
-
1 Mark:
- The student describes that economic profits attract new firms, leading to a decrease in demand for the existing firm, but lacks depth in explanation.
- Example: "Economic profits will attract new firms, which will decrease the demand for the existing firm’s product."
-
1–2 Marks:
- The student explains that new firms entering the market due to economic profits will cause the demand curve for the existing firm to become more elastic and shift left, partially addressing the long-run equilibrium.
- Example: "In the long run, economic profits attract new firms, increasing competition. This makes the demand curve for the existing firm more elastic and shifts it left, reducing economic profits."
-
2 Marks:
- The student provides a clear explanation of how the entry of new firms due to economic profits will shift the demand curve left until only normal profits are made, including a relevant diagram.
- Example: "Economic profits in the short run attract new firms, increasing market supply and shifting the demand curve for the existing firm left until only normal profits are made. This is shown in the diagram where the demand curve shifts from D1 to D2."
Sketch and label a diagram to illustrate the long-run equilibrium for a firm in monopolistic competition.
| Description | Marks |
|---|---|
| The work does not reach a standard described by the descriptors below. | 0 |
| The response indicates little understanding of the specific demands of the question. The diagram is poorly sketched with major inaccuracies. Economic terms are used incorrectly or not at all. No real-world example is provided. | 1 |
| The response indicates some understanding of the specific demands of the question. The diagram is sketched with some accuracy but lacks clear labeling or explanation. Some economic terms are used correctly. A real-world example is mentioned but not well integrated. | 2 |
| The response indicates a clear understanding of the specific demands of the question. The diagram is accurately sketched and labeled, showing the long-run equilibrium in monopolistic competition. Economic terms are used appropriately. A relevant real-world example is provided and integrated into the explanation. | 3 |
