




In IB Physics, Paper 2 data questions can feel like walking into a room where everyone is speaking in graphs. The axes look familiar, the numbers look harmless, and then the command term quietly changes everything. One minute you are “describing,” the next you are “evaluating,” and suddenly your brain is negotiating with a scatter plot.
The good news: IB Physics data analysis is learnable. Not by memorising tricks, but by using a calm routine that works under time pressure.
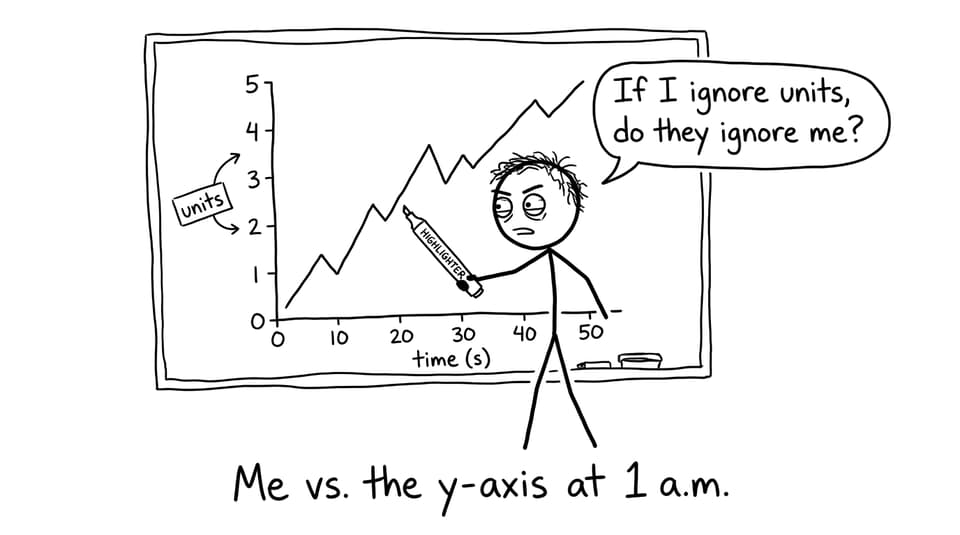
The beginner checklist for IB Physics data analysis
Keep this mini-checklist in mind whenever you see a table, graph, or experiment in IB Physics Paper 2:
-
Read the command term first (describe vs explain vs evaluate)
-
Identify variables, units, and scales
-
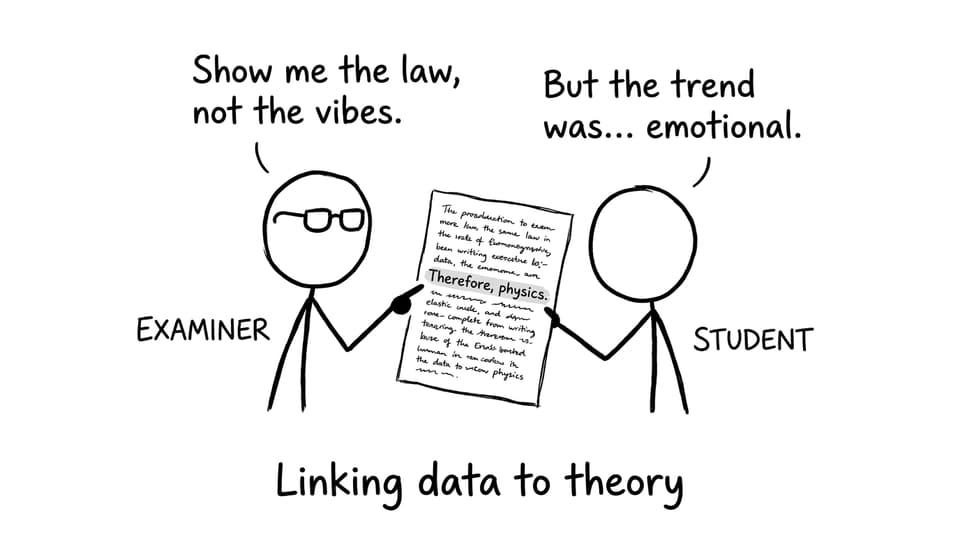
Describe the trend with numbers (not vibes)
-
Connect to a physics law/model
-
Comment on uncertainty, anomalies, and reliability only when asked
If you want a topic hub to tighten the foundations behind these questions, start with IB Physics Resources.
Start with the question, not the graph
Most lost marks in IB Physics happen before the first calculation. Students answer a different question than the one asked.
In Paper 2, command terms are your steering wheel:
-
Describe: what the data shows (trend + values + units)
-
Explain: why it happens (law/model + link to trend)
-
Calculate: compute exactly what’s requested, with units and sig figs
-
Evaluate: reliability, uncertainty, improvements, limitations
On RevisionDojo, the IB Physics Questionbank is ideal for drilling command terms because the questions repeat the same skill in different contexts until it becomes automatic.
Break down the data like a scientist (not a storyteller)
Before you interpret anything in IB Physics, do a quick “data scan”:
Identify the representation
Is it a table, line graph, scatter plot, or bar chart? Each implies different things about relationships and variation.
Read axes and units carefully
Units are often where marks hide. If the axis is in m s⁻¹ and you write “speed increases,” you are not wrong, but you are incomplete. In IB Physics, completeness is a scoring skill.
For formula support under pressure, keep the Physics Data Booklet - IB Formula Reference close during practice so you learn where everything lives.
Describe trends with numbers (the fastest marks in IB Physics)
A strong IB Physics trend description has three ingredients:
-
Direction: increases/decreases/constant
-
Shape: linear, proportional, inverse, exponential, plateau
-
Evidence: at least one pair of values with units
Instead of: “The graph goes up.”
Write: “As temperature increases from 300 K to 360 K, pressure increases approximately linearly from 100 kPa to 120 kPa.”
This is also where gradients and intercepts matter. If a straight-line fit is expected, say what the slope represents physically.
Explain the trend by pinning it to a law
In IB Physics, “explain” means “connect the pattern to theory and point back to the data.” A good explanation sounds like:
-
Name the model/law
-
State the relationship
-
Use the graph values to show the law fits
For example, if the trend is proportional, you might connect it to a rearranged equation. If the relationship curves, you might justify why linearisation would help.
To strengthen this skill, pair IB Physics Revision Notes (SL/HL) with targeted practice so you’re not searching for the right principle mid-question.
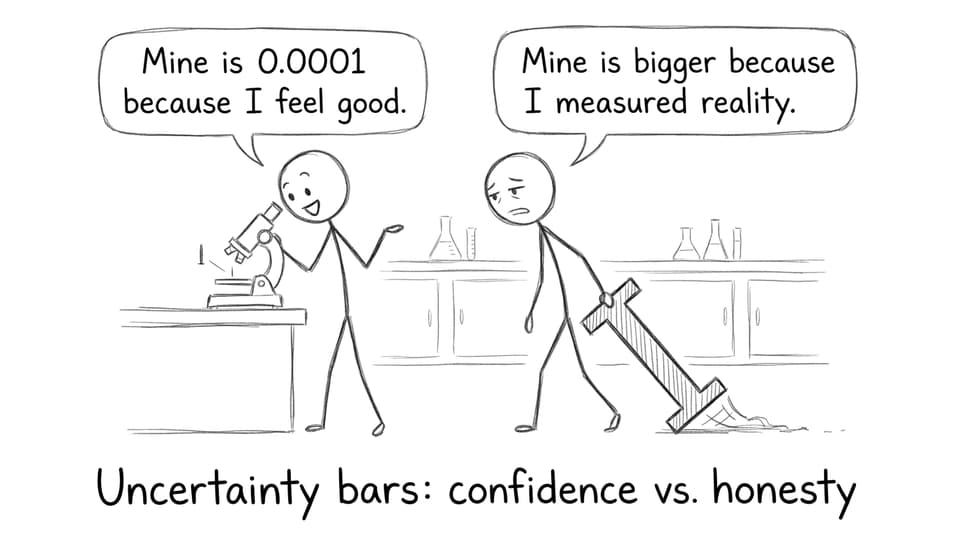
Uncertainty and evaluation: be honest, not dramatic
Evaluation marks in IB Physics usually reward precision in your thinking:
-
Distinguish random vs systematic effects
-
Comment on whether uncertainty bars overlap (if shown)
-
Explain anomalies with a plausible limitation
-
Suggest improvements that are specific and realistic
If uncertainties feel foggy, revise them directly with IB Physics Measurements and Uncertainties and practise exam phrasing using What Is the Formula to Calculate Absolute Uncertainty?.
A simple practice routine that actually sticks
If you’re preparing for exams, here’s a clean way to build speed in IB Physics data analysis:
-
Do 10 minutes a day of data-based questions in the IB Physics Questionbank
-
After each question, rewrite just one sentence: your best trend sentence with numbers
-
Use RevisionDojo’s AI Chat to ask: “What law should I cite here, and why?”
-
Use Grading tools to check whether your explanation actually links to the data
When you’re ready to simulate full Paper 2 pressure, add IB Physics Predicted Papers - Revision Dojo and treat them like mock exams (with RevisionDojo Mock Exams and feedback loops).
FAQ: IB Physics Paper 2 data analysis
Why do data-analysis questions matter so much in IB Physics?
Data questions reward clear thinking more than fancy memory. In IB Physics, you can often earn marks by reading a graph carefully, stating a trend precisely, and tying it to a standard relationship. That makes these questions surprisingly “fair,” especially when you are stressed and recall feels unreliable. They also test skills that show up across topics: proportionality, gradients, units, uncertainty, and scientific communication. If you get good at this style, it lifts your performance in multiple parts of Paper 2. Over time, data analysis becomes one of the most controllable sources of marks in IB Physics.
Should I do extra calculations even if the IB Physics question doesn’t ask?
Usually, no. In IB Physics, unrequested calculations can waste time and can even introduce inconsistencies if you round differently or make a slip. Examiners award marks for doing what the command term asks, not for showing everything you could do. If the question says “describe,” focus on the trend and evidence from values. If it says “explain,” focus on the physics law and how the data supports it. Save calculations for when “calculate,” “determine,” or a numerical value is explicitly requested.
What counts as a valid “trend” in IB Physics data?
A trend is any consistent relationship you can justify using the displayed values. In IB Physics, that might be linear increase, proportionality through the origin, inverse behaviour, a plateau, a maximum/minimum, or a change in gradient. It can also include comparisons, such as one dataset increasing faster than another. The key is that you support your statement with numbers and units, not just a description of the line’s shape. If there are anomalies, you can still state the overall trend while identifying the outlier point(s). Done well, this shows the examiner you can read data like a physicist.
How can I improve quickly if I’m currently “slow” at IB Physics data questions?
Speed in IB Physics comes from removing decisions. Use the same order every time: command term, variables/units, trend-with-numbers, then theory link, then evaluation if required. Practise in short bursts so you stay accurate: 2 questions timed, then review. RevisionDojo helps because you can isolate exactly the skill you’re missing using the Questionbank, then reinforce it with Study Notes and Flashcards. If you’re unsure why your explanation doesn’t score, ask the AI Chat to rewrite your answer in a markscheme style, then compare. After a week of this, most students notice their answers get both shorter and higher scoring.
Bringing it all together
Paper 2 data analysis in IB Physics isn’t about having a “physics personality.” It’s about being methodical: read the task, read the units, describe the trend with evidence, and then anchor it to a law you trust. If you build that routine now, your future self in the exam hall will feel something rare: calm.
To practise efficiently, use RevisionDojo’s Questionbank, Study Notes, Flashcards, AI Chat, Grading tools, Predicted Papers, Mock Exams, Coursework Library, and Tutors to turn data analysis into a reliable strength in IB Physics.