



In IB ESS, there’s a moment most students recognize: you stare at a population graph and it stares back, silently asking whether you understand limits. Not “limits” like a revision timetable, but the kind that decide whether a system stabilizes, overshoots, or collapses.
Carrying capacity models sit right in that tension. For the 2026 first assessment, IB ESS expects you to read these models like stories: what conditions allowed growth, what pressures pushed back, and what happens when humans refuse to treat Earth like a finite system.
Quick checklist: what you must know for IB ESS
Before you call this topic “done,” make sure you can:
-
Define carrying capacity (K) in one precise sentence.
-
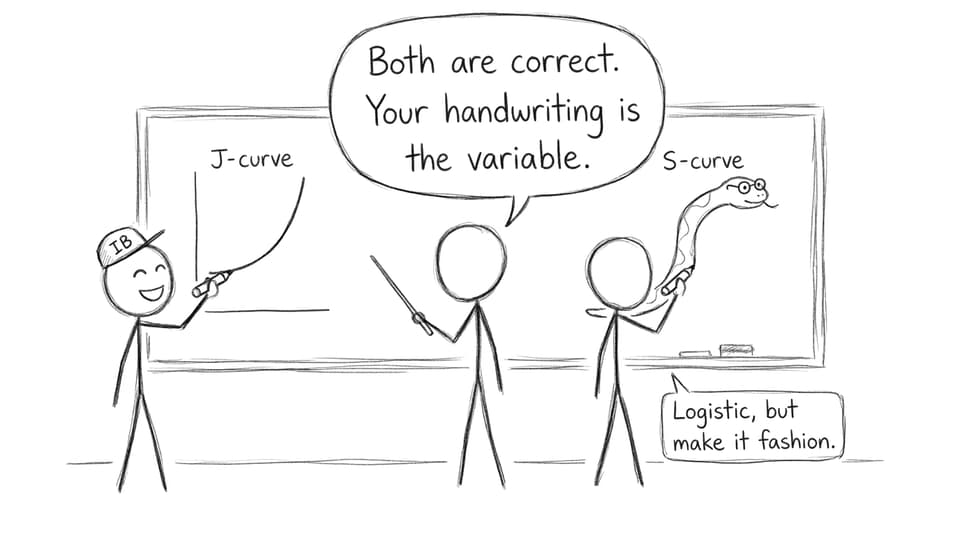
Sketch and interpret a J-curve and an S-curve.
-
Explain what limits growth (limiting factors, environmental resistance).
-
Apply models to humans and evaluate why it’s controversial.
-
Use at least one case study to anchor your explanation.
If you want the syllabus wording and a clean definition, start with Carrying capacity (2.1D) notes.
What carrying capacity means (and why it’s rarely “fixed”)
Carrying capacity is the maximum population size an environment can support sustainably over time, given available resources and the environment’s ability to absorb waste. In IB ESS, the key word is “sustainably”, not just surviving for a month, but persisting without degrading the system.
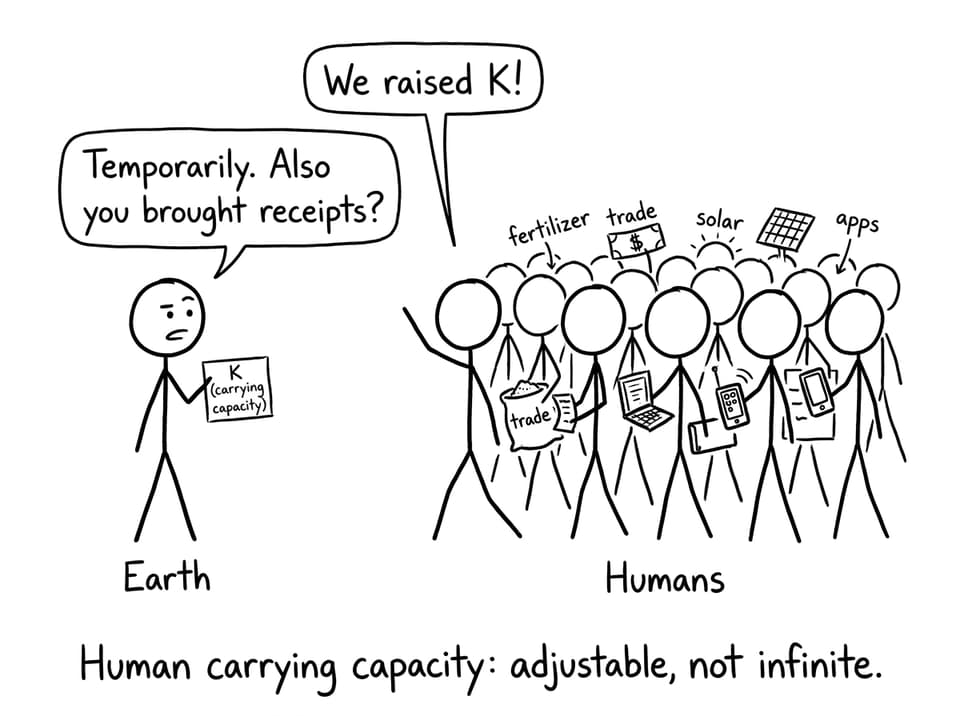
For non-human populations, K can be estimated from habitat quality, food supply, and competition. For humans, it gets messy because we change the rules: we import resources, intensify agriculture, and shift consumption patterns. That flexibility is exactly what makes IB ESS exam answers stronger when they include a short evaluation.
The two carrying capacity models you need: J-curve and S-curve
Exponential growth model (J-curve)
In the exponential growth model, populations increase rapidly when resources are abundant and limiting factors are minimal. The curve is J-shaped because growth accelerates over time.
In IB ESS, you’re usually expected to:
-
Recognize the J-curve on a graph.
-
Explain that it’s unrealistic long-term because limits eventually appear.
-
Mention overshoot risk (growth outpaces resources).
You can reinforce this with Population size and growth (2.1E) notes, which break down how growth changes as conditions shift.
Logistic growth model (S-curve)
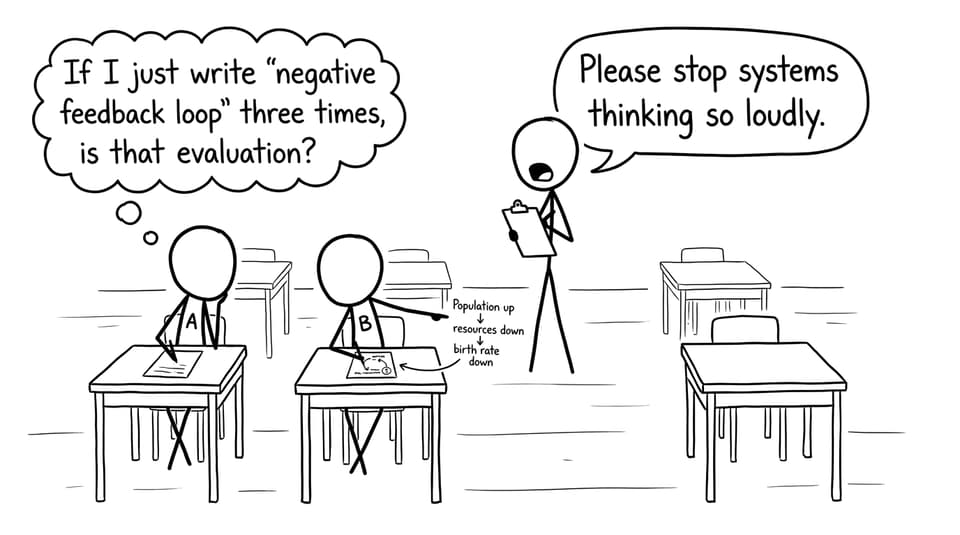
In the logistic growth model, growth starts fast but slows as limiting factors intensify. The curve becomes S-shaped and levels off around carrying capacity (K). This model builds in the idea of negative feedback: as population rises, resources fall, competition increases, and growth rate drops.
In IB ESS exams, logistic growth is your opportunity to use systems language: feedback loops, equilibrium, and stability. That is often where the marks are.
Applying carrying capacity to humans in IB ESS (what examiners really want)
Human carrying capacity is influenced by more than food and water. IB ESS expects you to show you understand the drivers that can raise or lower K:
-
Technology (fertilizers, irrigation, energy systems)
-
Trade (importing food, exporting pollution)
-
Culture and consumption (diet, waste, material expectations)
-
Politics and inequality (who gets resources, who bears costs)
This links naturally to sustainability models like ecological footprint and biocapacity. A neat connection (and a common exam move) is: higher ecological footprint per person typically lowers sustainable carrying capacity.
For that link, use Human population carrying capacity notes and the exam-focused companion, How ecological footprints are tested in ESS exams (2026).
Case studies that make the models feel real
You don’t need a long list, but you do need one or two memorable examples you can adapt:
-
Easter Island: resource depletion (deforestation) followed by societal decline: often used to illustrate overshoot.
-
The Sahel: fragile soils + population pressure + climate stress can reduce effective carrying capacity.
-
Japan: high population density sustained through trade and technology (a useful contrast when evaluating “fixed” K).
When you revise these, place them into a model: Was it closer to exponential growth with overshoot? Logistic stabilization? Or a human-modified system where K shifts over time?
How this shows up in IB ESS exams
In IB ESS, carrying capacity is rarely asked as a definition only. More commonly:
-
You interpret a graph (identify J-curve vs S-curve, describe trend, link to limiting factors).
-
You explain why carrying capacity is hard to calculate for humans.
-
You evaluate the usefulness of the concept using sustainability language.
For targeted practice, the fastest way is timed questions from the Human systems and resource use hub and the 8.4 Human population carrying capacity Questionbank.
A final way to remember it (and what to do next)
If IB ESS carrying capacity models feel slippery, remember this: exponential growth is what happens when limits are absent; logistic growth is what happens when limits push back. Human systems complicate both because we can delay limits, relocate them, or ignore them, until the feedback arrives anyway.
To lock this down before exams, use RevisionDojo as your workflow: learn the definitions in Study Notes, drill them with Flashcards, test interpretation with the Questionbank, and use AI Chat to practice “evaluate” paragraphs without wasting time. Add Mock Exams, Predicted Papers, and Grading tools when you’re ready to simulate pressure. That’s how IB ESS stops being a topic you “kind of get” and becomes one you can score on.