

Statistical analysis in a science IA is where a pile of numbers becomes an argument.
Most students feel that shift at the same moment: you’ve finished the experiment, you open a spreadsheet, and the neat story you expected turns into noise. Two trials disagree. A graph looks unimpressive. You start wondering whether your IA is “bad” -- when really, you just haven’t given your data the right language yet.
This guide shows how to use statistical analysis effectively in an IB science IA (Biology, Chemistry, Physics, ESS, SEHS). Not with fancy methods you can’t explain, but with the kind of choices examiners trust: appropriate tests, clear uncertainty, honest interpretation, and evaluation that links back to your research question.
Quick checklist: statistics that actually earns IA marks
Use this as a final sweep before you write up your analysis section.
-
Your IA has enough data points (repeats, sensible range, consistent units)
-
You’ve chosen 1--2 statistical tools that match your question (not just what Excel offers)
-
Graphs are labeled, readable, and include uncertainty (error bars where appropriate)
-
You explain the meaning of the statistics in context (not just the numbers)
-
You use statistics in evaluation: reliability, limitations, improvements
If you want to see what “good” looks like across subjects, browse RevisionDojo’s Coursework Exemplars and notice how calm the analysis sounds when the statistics are purposeful.
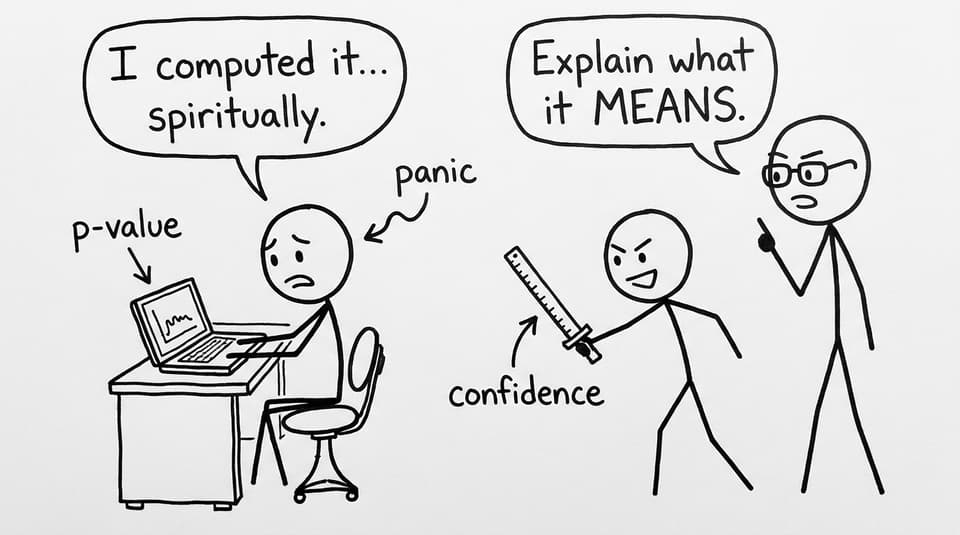
Why statistical analysis matters in a science IA
An examiner is not grading whether you can generate a p-value. They are grading whether your IA behaves like science: claims matched to evidence, uncertainty acknowledged, and conclusions written with restraint.
In practice, statistics helps you do three examiner-friendly things:
-
Show reliability: Are your measurements consistent, or scattered?
-
Show significance: Is the difference/relationship likely meaningful, or plausibly random?
-
Show thinking: Can you interpret outcomes and limitations without forcing a perfect result?
A strong IA doesn’t pretend the data is flawless. It uses analysis to show you understand what the data can and cannot support.
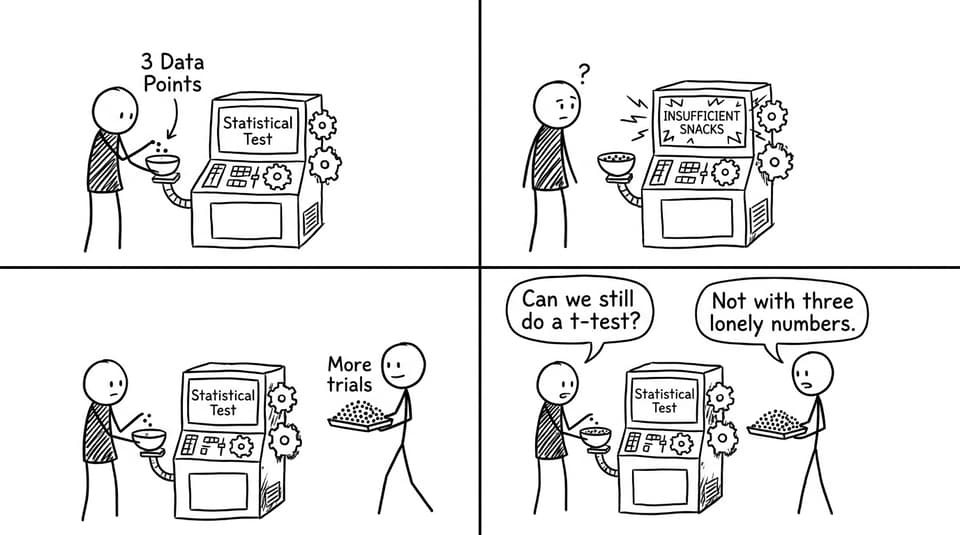
Start with data that can handle statistics (before you test anything)
Statistical analysis collapses when the dataset is too thin. Before choosing any test, check whether your IA design supports processing.
Minimum habits that save your IA
-
Repeats: Aim for 3--5 repeats at each level of your independent variable.
-
Range: A narrow range makes patterns hard to detect (and makes graphs look flat).
-
Precision: If your measurement tool is crude, your standard deviation will tell on you.
-
Consistency: Units, timing, and method must be stable across trials.
If you’re unsure whether your plan is “statistically viable,” use RevisionDojo’s IB Internal Assessment Guides to sanity-check expectations, then ask RevisionDojo’s AI Chat to stress-test your design: “Is this enough repeats for a meaningful comparison?”
Choosing the right statistical test for your IA (simple beats flashy)
The best test is the one you can explain in plain language and connect directly to the research question in your IA.
Descriptive stats (almost always)
Descriptive statistics are the backbone of most science IA write-ups.
-
Mean: Your “headline” result for each condition.
-
Standard deviation: How spread out your repeats are (a reliability signal).
-
Range: Quick sense-check for outliers and measurement drift.
Inferential stats (when your question demands it)
Pick one method that matches your data type and purpose.
-
t-test: Comparing two means (e.g., two treatments, two conditions).
-
Chi-squared test: Comparing observed vs expected frequencies (common in genetics-style data).
-
Correlation (Pearson’s r): Testing the strength of a linear relationship (e.g., temperature vs rate).
If you want a clean model for how to explain these choices in writing, the logic transfers well from math explorations too: see How to Explain Statistical Analysis in the IB Math IA.
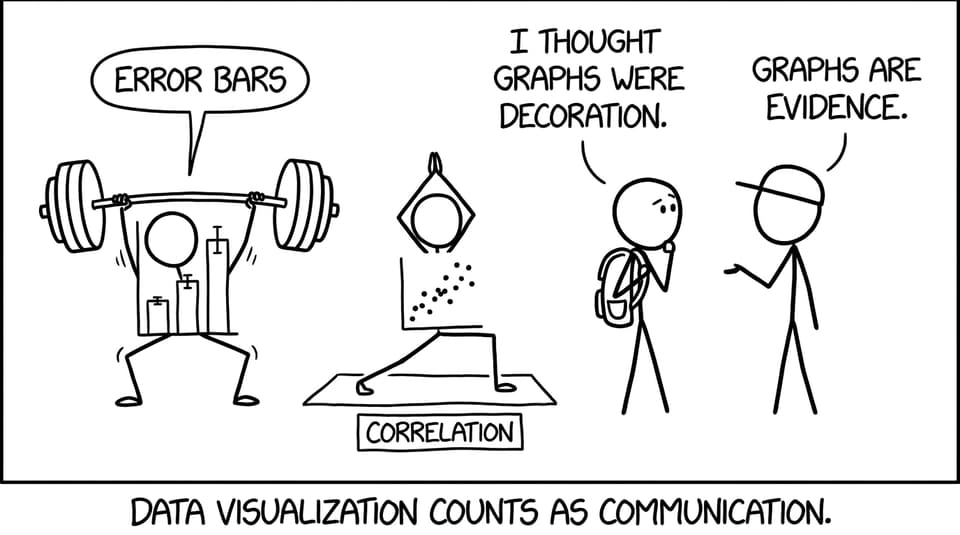
Graphs: the quiet way to look like a top student
A science IA is partly a communication task. Your graphs should let someone understand the trend and uncertainty in seconds.
What examiners want to see
-
Axes labeled with units
-
A title that matches the IA research question
-
Appropriate graph type (scatter for relationships, bar/line for comparisons)
-
Error bars when you have repeats
-
A short caption that tells the reader what to notice
A useful way to train this is to revise “data processing language” alongside your content. Chemistry students, for example, often benefit from the structure in Measurement and data processing.
Interpretation: the sentence pattern that upgrades your IA instantly
Many IA drafts stop at reporting. High-scoring drafts interpret.
Use this simple structure whenever you present a statistic:
-
Result (what you calculated)
-
Meaning (what it implies in context)
-
Link (how it answers the research question)
-
Limit (what the statistic does not prove)
Example (comparison)
-
Reporting: “The t-test gave p < 0.05.”
-
Interpreting: “A t-test produced p < 0.05, suggesting the difference in mean enzyme activity between pH 6 and pH 8 is unlikely to be due to random variation alone. This supports the hypothesis that pH affects enzyme activity within the tested range. However, the test does not identify the mechanism, and the conclusion is limited by temperature control and measurement precision.”
That last sentence is not filler -- it’s examiner trust.
To see how examiners describe this “analysis over description” mindset across criteria, read What IB Examiners Look for in a Strong IA.
Using statistics in evaluation (where marks hide)
Your evaluation becomes sharper when it references your processed data.
Reliability and uncertainty
-
Large standard deviations or wide error bars? Discuss measurement consistency, technique drift, or uncontrolled variables.
-
Tight error bars? Explain why your method produced stable results (and what you controlled well).
Outliers without drama
Don’t delete outliers silently. In your IA, either justify exclusion (with a clear reason) or keep them and discuss how they affect your confidence.
Improvements that match the numbers
Weak evaluation sounds like: “Do more trials.”
Strong evaluation sounds like: “Because SD increased at higher temperatures, repeats should be increased specifically above 35°C, and a thermostatically controlled water bath should reduce temperature fluctuations that likely contributed to spread.”
If you want a list of common traps to avoid, see Top IB Science IA Mistakes and How to Avoid Them.
How RevisionDojo helps you write a statistical analysis that’s examiner-ready
A good IA is built like exam prep: small feedback loops.
-
Use the Questionbank to practice data-analysis style questions so your interpretation language becomes automatic.
-
Use IB Flashcards with Spaced Repetition (SRS) to lock in definitions like standard deviation, uncertainty, and correlation without re-learning them every week.
-
Use subject hubs like IB Biology Resources or IB Chemistry Resources to keep your scientific explanation aligned to syllabus language.
-
Use the Coursework Library via Coursework Exemplars to calibrate how much processing is “enough.”
-
When you’re stuck between two tests or unsure how to phrase a conclusion, RevisionDojo’s AI Chat can help you pick the simpler, defendable route.
-
Before submission, use How to Proofread and Polish Your IA Before Submission to do a final clarity pass so your statistics reads as insight, not clutter.
Conclusion: make your IA sound like science
In a science IA, statistical analysis is not decoration -- it’s how you prove that your conclusion deserves to exist.
Collect enough data to justify processing, choose one test you can explain calmly, present graphs that show uncertainty, and interpret results with honesty. Then use those same statistics to write a sharper evaluation, because that’s where your thinking becomes visible.
If you want your next draft to feel less like guessing and more like control, start with RevisionDojo’s Coursework Exemplars, then reinforce the skills through RevisionDojo’s Study Notes, Flashcards, Questionbank, Mock Exams, Predicted Papers, Grading tools, and Tutors. Your IA doesn’t need to be perfect. It needs to be defensible.

