


The night before an IA deadline, data starts to look like a foreign language. Numbers blur. Graphs multiply. And suddenly you’re tempted to paste in one more chart because it feels like work.
But examiners don’t grade effort. They grade thinking.
In a strong IA, data isn’t decoration. It’s the backbone of your argument. Whether you’re handling trial results in a science IA, source patterns in a History IA, or a model fit in a Math IA, the goal is the same: use data to make your conclusion feel inevitable.
If you want models of what that looks like in real student work, start with RevisionDojo’s coursework exemplars. Seeing how high-scoring students talk to their data changes everything.
IA data checklist (the fast version)
Before you polish wording, run this checklist through your IA analysis:
-
Your data is relevant to the research question or aim of the IA
-
You present processed data in the main body (raw data goes elsewhere)
-
Every figure has labels, units, and a clear caption
-
You interpret patterns and meaning, not just what the graph “shows”
-
You connect each claim back to your IA focus
-
You acknowledge limitations, anomalies, and uncertainty with impact
For a deeper write-up framework, keep 10 best practices to write up data and results in your IB IA open while you edit.
Why data handling makes or breaks an IA
A quiet truth about the IA is that most students can collect “fine” data. The mark difference comes from what happens next.
Examiners are watching for four signals:
-
Clarity: can they understand your evidence in seconds?
-
Accuracy: are calculations, labels, and visuals consistent?
-
Analysis: do you explain why the trend exists?
-
Evaluation: do you discuss what makes you more or less confident?
If you’re not sure what “analysis” vs “description” looks like, How to analyze graphs and results in the IB Math IA is a useful transfer skill even outside math.
Collect reliable data (so your IA has something to stand on)
Your IA analysis can’t outsmart shaky evidence. Reliability looks different by subject, but the principle is stable: make choices that reduce doubt.
-
In a science IA, this often means enough trials, careful control of variables, and consistent measurement.
-
In a humanities IA, it means balanced sourcing and clearly justified selection of evidence.
-
In a math IA, it means datasets large enough to show patterns and not just coincidences.
Whatever your subject, document where the data came from and why it’s appropriate. If you’re still shaping your focus, How to write a strong IA research question helps you build a question that your data can actually answer.
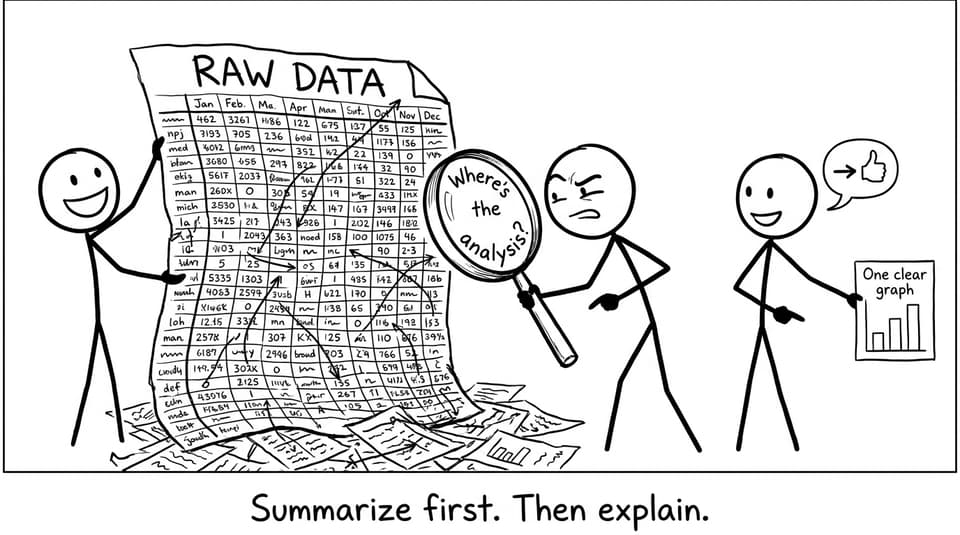
Present data like you respect the reader
A clean visual is a form of generosity. It says: “I’ve done the sorting, so you can do the thinking.”
In a high-scoring IA, visuals are purposeful:
-
Use titles that state what the reader is about to learn
-
Label axes, include units, and keep scaling sensible
-
Choose graph types based on purpose (trend, comparison, distribution)
-
Avoid duplicating the same information in multiple forms
If you want a dedicated guide on visual choices, read How to present data visually in your IA. And when you’re deciding how much to include, How many graphs should an IA include? saves you from the “more must be better” trap.
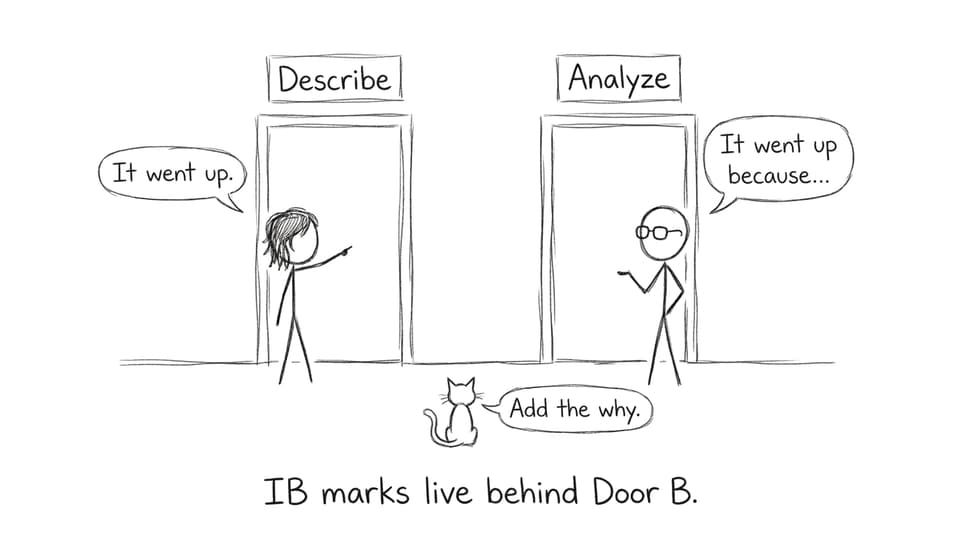
Analyze, don’t narrate: the sentence upgrade your IA needs
A common IA weakness is writing captions in paragraph form.
-
Narration: “Figure 2 shows that results increase as X increases.”
-
Analysis: “As X increases, Y rises at a diminishing rate, suggesting a limiting factor. This supports the expectation from theory because __, but the flattening after __ indicates __.”
A practical editing move: after every result, force yourself to write three lines:
-
So what? (meaning)
-
Why might that be? (mechanism/theory)
-
What does it do to my confidence? (uncertainty/limitations)
That simple rhythm turns data into argument, which is what an examiner is hunting for.
Link every data point back to your IA focus
Your IA is not a scrapbook. Every table, quote, or graph has to earn its space.
After you present evidence, add one explicit line that connects it to your aim:
- “This trend matters because it suggests __, which directly addresses my research question by __.”
When students skip this, examiners do extra work to infer relevance. And if an examiner has to work to understand the point, you usually lose marks.
If your draft is ballooning, Can an IA be too long? The real IB answer is a calm reminder that clarity beats volume.
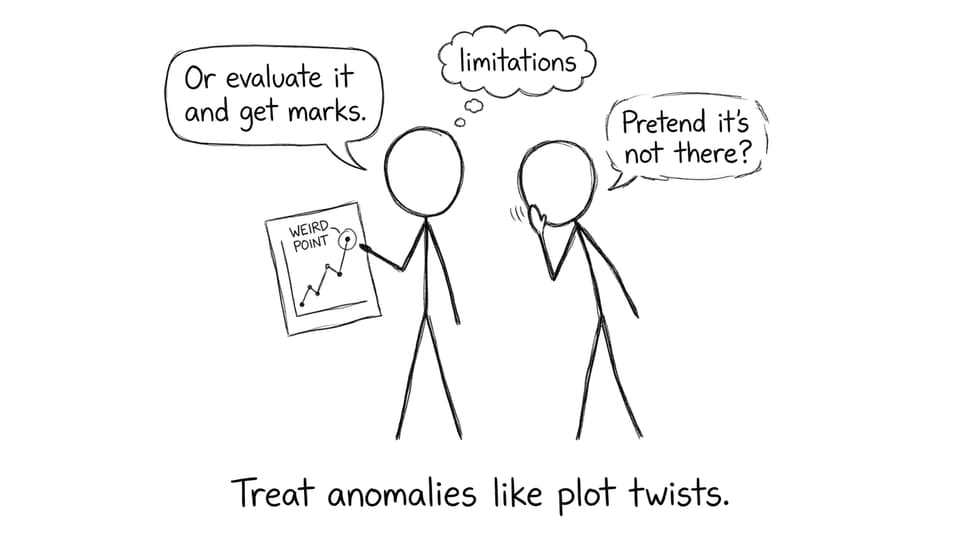
Evaluate limitations and anomalies like an adult
In real research, clean data is rare. A strong IA doesn’t hide that. It explains it.
Instead of listing generic issues (“human error,” “small sample size”), talk about:
-
What specifically went wrong or could be biased
-
How it likely affected the trend or conclusion
-
What realistic improvement would reduce the impact
If your evaluation feels thin, Why most IA evaluations are too weak is worth a read, then follow with How to write a compelling IA evaluation section.
RevisionDojo tools that make IA data work easier
At some point, every IA becomes an editing problem: too many visuals, not enough interpretation, unclear links to criteria. This is where RevisionDojo quietly saves hours.
-
The Coursework Exemplars library gives you real, high-scoring IA models so you can benchmark your structure and depth.
-
RevisionDojo’s Grading tools help you check whether your analysis and evaluation actually match rubric language.
-
AI Chat can help you test your reasoning: “What alternative explanation could fit this trend?” (You still write the final logic.)
-
Study Notes and Flashcards support the theory behind your analysis, so you’re not hand-waving.
-
For exam season, Questionbank, Predicted Papers, and Mock Exams keep coursework and revision aligned, so your IA doesn’t steal all your time.
-
If you’re stuck, Tutors can help you refine methodology and interpret results without crossing authenticity lines.
Conclusion: Make your IA data tell a story with a point
A high-scoring IA isn’t the one with the most data. It’s the one where the data clearly answers the question, and the analysis shows mature judgment about what the evidence can and cannot prove.
If you want your IA to read like an argument an examiner can trust, build on clear presentation, disciplined interpretation, and specific evaluation. Then sanity-check your structure against real examples in RevisionDojo’s coursework exemplars and tighten your draft with rubric-focused feedback using RevisionDojo’s Grading tools and AI Chat.
Your data already has a story. Your job is to make it readable, honest, and impossible to ignore.
