

Data presentation in an IA is a quiet kind of power.
You can spend weeks collecting measurements, running trials, and calculating averages, then lose momentum in the last mile: charts that confuse, tables that hide the point, and visuals that look “busy” instead of believable. Examiners don’t have time to decode your intentions. They reward clarity. The easiest way to earn that clarity is to treat every graph and table as part of your argument, not an attachment.
In this guide, you’ll learn how to present data visually in your IA so it reads fast, feels professional, and strengthens your analysis. If you want to see what “examiner-friendly” visuals look like in real student work, start with RevisionDojo’s Coursework Exemplars.
Quick checklist for IA visuals
Use this as your final scan before submission. In a strong IA, most visuals can answer “yes” to these:
-
Does this visual help answer the research question?
-
Did you choose the right format (table vs graph type)?
-
Are title, labels, units, and figure numbers complete?
-
Is raw data separated from processed data?
-
Are uncertainty and variability shown where appropriate?
-
Do you reference the visual directly in your writing?
For a deeper “results write-up” checklist, see 10 Best Practices to Write Up Data and Results in Your IB IA.
Choose the best visual format for your IA data
A helpful rule: pick the format that makes the pattern unavoidable.
Tables: for evidence you may need to verify
Tables are ideal for:
-
Raw measurements (with units and uncertainties)
-
Processed values (means, standard deviations, percentage change)
-
Summary statistics that support your evaluation
A table in your IA should read like a tidy ledger: consistent decimals, consistent units, and headers that do the heavy lifting.
Line graphs: for trends across a continuous change
Use line graphs when your independent variable changes smoothly (time, temperature steps, concentration levels). Line graphs make it easy to discuss direction, rate, turning points, and plateaus.
Bar charts: for comparisons between groups
Bar charts are best when you compare categories (different conditions, groups, or treatments). If you use bars in your IA, add error bars when you’re showing means.
Scatter plots: for relationships and correlation
Scatter plots are the backbone of many Science and Math IA investigations because they show correlation, allow a best-fit model, and make anomalies visible.
Histograms: for distributions
Use histograms when you’re showing frequency distributions (for example, score ranges, reaction times, or repeated measurements binned into intervals).
If you’re still unsure what “enough graphs” looks like, this guide gives a realistic benchmark: How Many Graphs Should an IA Include?
Label everything so your IA figures can stand alone
A high-scoring IA doesn’t make the examiner guess.
Every figure and table should include:
-
A descriptive title (what, where, and which variables)
-
Axis labels with units (not just “Time” but “Time (s)”)
-
A legend when more than one data set appears
-
Figure/table numbering you actually use in your text (Figure 1, Table 2)
If you want an examiner-style reminder of what must appear in graphs and tables (including uncertainty conventions), see Recording Data (IB Physics IA Guide) and the broader IB Internal Assessment Guides.
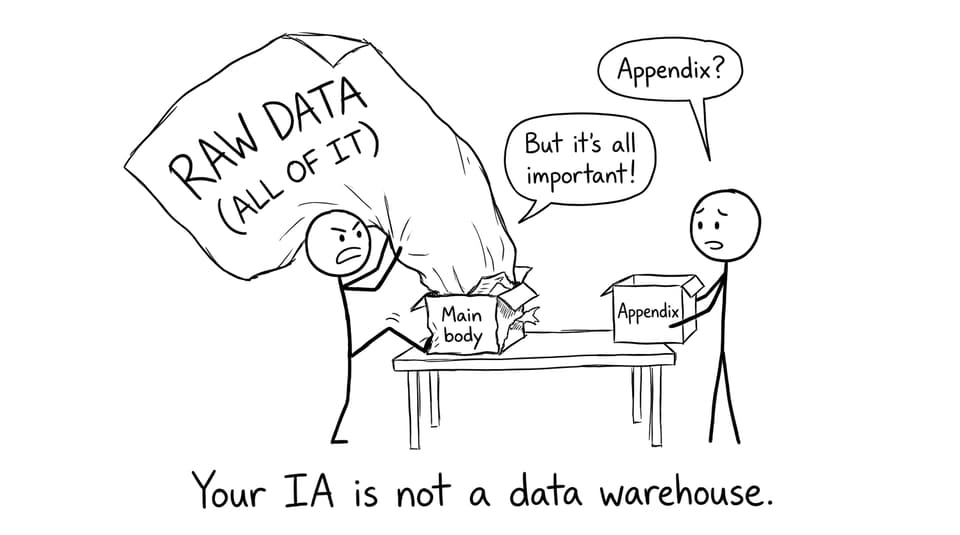
Show processed data (and keep raw data under control)
Raw data proves you did the work. Processed data proves you understood it.
A clean structure that works in almost any IA:
-
Raw data table: representative trials, correct precision, uncertainties included
-
Processed data table: averages, standard deviation, derived values, calculated uncertainties
-
Graph of processed results: the visual you analyze in detail
When you include every single raw reading in the main body, your IA starts to feel like storage instead of storytelling. Consider summarizing repeated trials (mean ± SD) and moving full logs to an appendix when allowed.
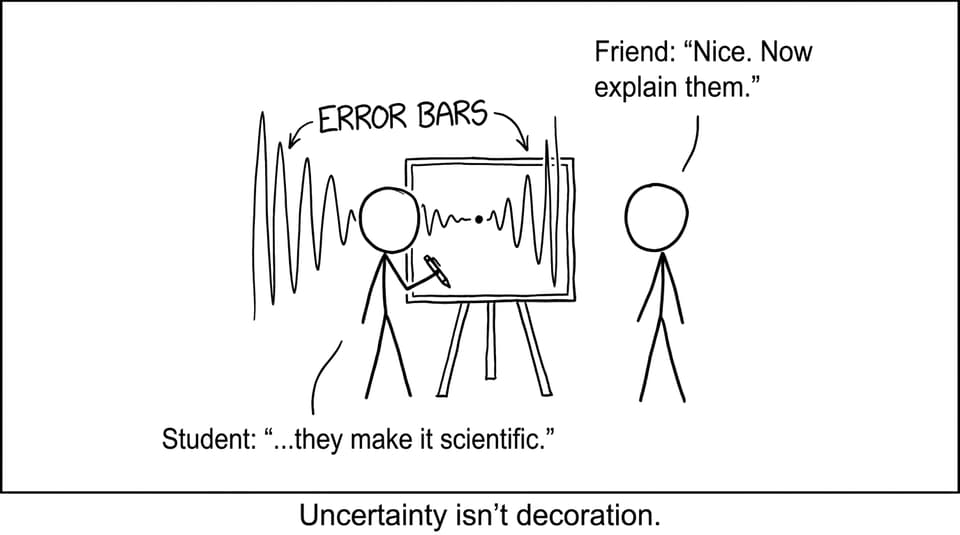
Use error bars and uncertainty like a real scientist
Uncertainty is not a confession. In a strong IA, it’s credibility.
Error bars help the examiner see variability at a glance and give you something concrete to evaluate:
-
Do conditions overlap within uncertainty?
-
Are differences meaningful or likely random variation?
-
Do anomalies fall outside expected ranges?
If you need a quick refresher on uncertainty language and how to handle it correctly, see Notes for 1.2 -- Uncertainties and errors.
Integrate visuals into your IA analysis (don’t let them sit silently)
The most common visual mistake in an IA is dropping in a graph and hoping it “speaks for itself.” Examiners don’t reward hope. They reward interpretation.
A reliable sentence pattern:
-
Point to the figure: “Figure 2 shows…”
-
Describe the pattern: “…a steady increase up to…”
-
Interpret it: “…which suggests…”
-
Connect to the research question: “…supporting the claim that…”
-
Evaluate reliability: “However, the large error bars at…”
If your analysis still feels too descriptive, pairing your figures with sharper interpretation helps. This companion post is useful: How to Use Data Effectively in Your IA Analysis.
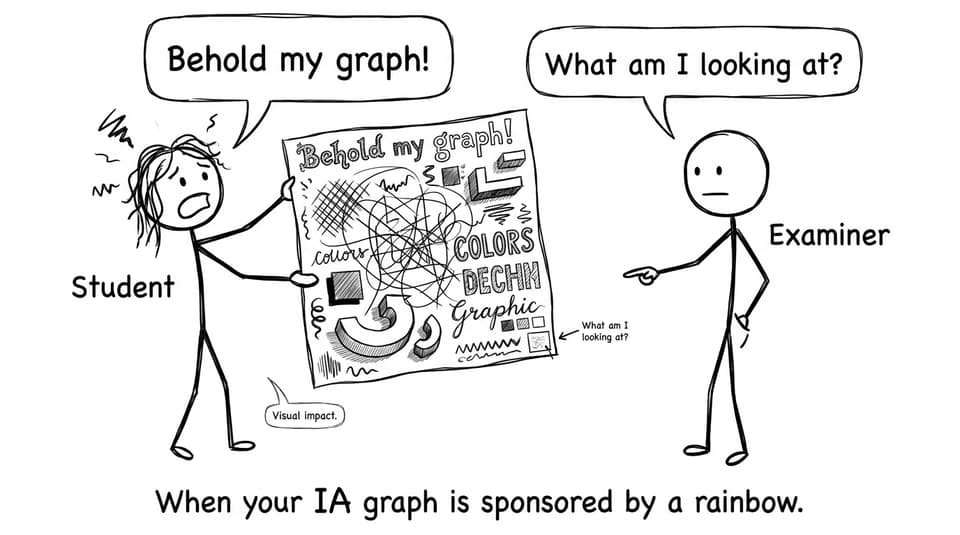
Keep visuals professional (simple beats flashy)
A professional IA visual is calm:
-
Use readable font sizes
-
Avoid 3D charts and heavy gradients
-
Limit colors to meaning (not decoration)
-
Choose scales that use most of the plotting area
-
Don’t connect dots unless a line graph is genuinely appropriate
If you’re building a data-heavy investigation and worried about consistency, see How to Ensure Accuracy in Data-Heavy IAs.
Conclusion: Make your IA easy to reward
A great IA doesn’t just have results. It has results that are visible, readable, and integrated into a clear argument.
Choose the right format, label like your reader is busy, separate raw from processed data, show uncertainty honestly, and narrate what each figure means. If you want to accelerate your progress, RevisionDojo helps you study smarter across the entire Diploma: use the Coursework Library to see what top work looks like, the Study Notes and Flashcards to lock in the content behind your variables, the Questionbank and Mock Exams to keep exam prep moving, and AI Chat plus grading tools to sanity-check whether your analysis actually matches what your visuals show. When you’re ready for high-quality models, start here: RevisionDojo’s Coursework Exemplars.

