


A data-heavy IA can feel like carrying a glass of water through a crowded hallway. You can do everything right and still spill it because someone bumps you at the last second. That’s what accuracy is in an IA: not a vague “be careful,” but a system that protects your work from tiny, expensive mistakes.
Examiners don’t reward the biggest dataset. They reward the student who can prove the dataset is trustworthy, and who can explain what might have gone wrong without hiding it.
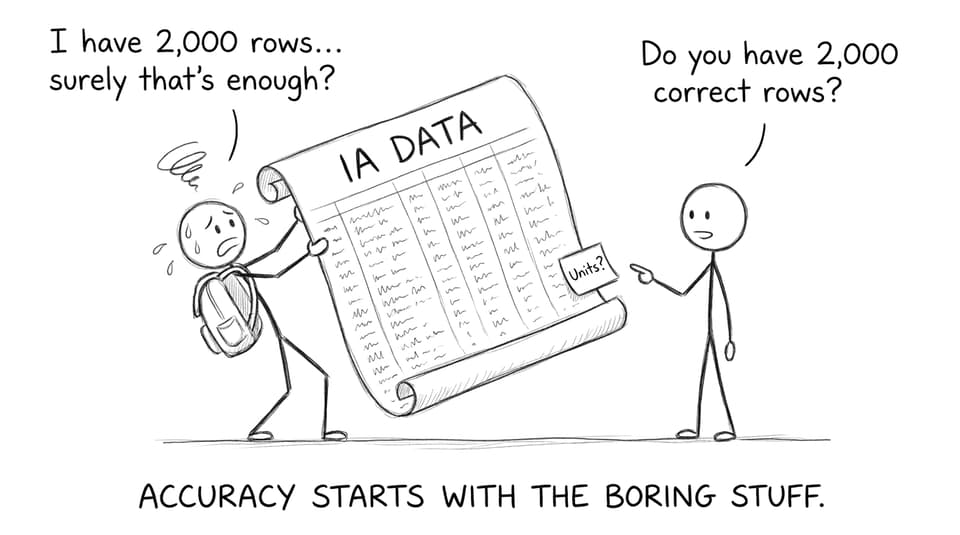
IA accuracy checklist (save this before you write)
Use this quick checklist to keep your IA accurate from start to finish:
-
Define variables and units once, then never improvise them later.
-
Build a repeatable data-collection routine (same steps, same order).
-
Calibrate tools and record uncertainty where relevant.
-
Use replicates and a sensible sample size (reliability without chaos).
-
Validate calculations with a second method or a spot-check.
-
Present data so a tired examiner can’t misunderstand it.
-
Name limitations clearly (and link them to impact on results).
If you want more IA-specific guidance, start by comparing your plan to the examiner expectations in How to Use Data Effectively in Your IA Analysis.
Designing your IA so accuracy is “built in”
Most IA inaccuracies aren’t “bad math.” They come from a messy design that forces you to guess later.
Lock in variables, units, and recording format
Before you collect anything, create a mini “data dictionary” in your draft:
-
Independent variable (exactly how it changes)
-
Dependent variable (exactly what you measure)
-
Controlled variables (what stays constant)
-
Units (with prefixes: m vs cm, kPa vs Pa)
-
Table structure (column names you will actually use)
This one step prevents the classic IA problem: you collect clean data, then accidentally mix units or labels when writing up.
Choose a sample size you can defend
A huge dataset looks impressive until it becomes uncheckable. In a data-heavy IA, accuracy improves when you can:
-
repeat trials consistently,
-
spot anomalies quickly,
-
and explain why your sample size supports reliability.
If you’re working with statistics or regression, RevisionDojo’s math resources can help you sanity-check your approach in Statistics and Probability (IB Math AI).
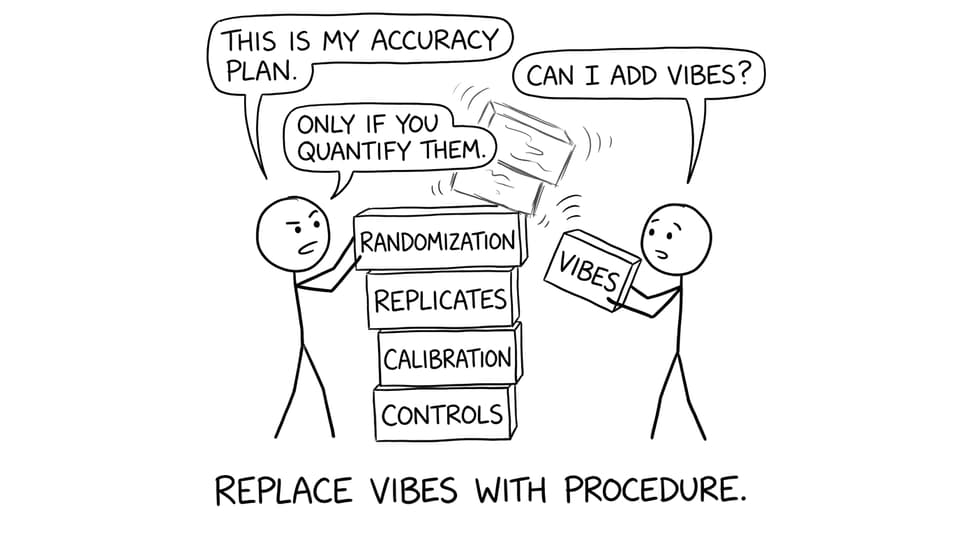
Collecting accurate IA data (where most marks are silently lost)
In many subjects, your IA gets judged by how well your method protects the data.
Standardize your routine
Write your procedure like you’re teaching a careful stranger. Then follow it exactly. Accuracy comes from consistency: same environment, same timing, same measurement technique.
Measure uncertainty (and don’t pretend it’s optional)
Uncertainty is not “extra.” It’s part of accuracy. Include absolute uncertainty in raw data where appropriate, and use error bars when presenting trends.
A great reference for how IB expects uncertainties and error bars to appear is Criterion C: Analysis and Line of Argument (ESS).
Prevent transcription errors
For a data-heavy IA, typing mistakes are the silent killer. Use strategies like:
-
drop-down lists for categories,
-
consistent decimal places,
-
and a “raw data first” rule (never overwrite raw values).
Analyzing your IA without letting math mistakes rewrite the story
A clean analysis doesn’t mean complicated analysis. It means your reasoning matches your data.
Pick the right statistical tool
Use tests that match your variable types and question (correlation, regression, chi-square, t-test, etc.). If you’re doing regression, RevisionDojo’s focused support helps you keep terminology and interpretation tight in X on y regression line notes.
Cross-check calculations like an examiner would
Do at least one of these:
-
recompute key values with a second tool,
-
hand-calculate one row as a check,
-
or spot-check formulas (especially if you drag-fill).
If you want a structured way to discuss fit quality (R², residuals, model limitations), use How to Evaluate Model Fit Using Statistical Tools.
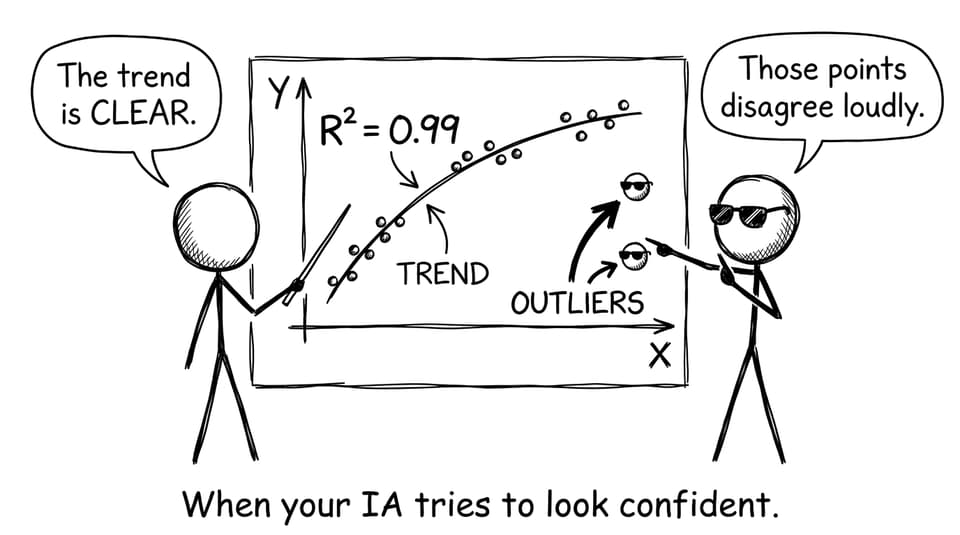
Presenting your IA so your accuracy is obvious
In a data-heavy IA, presentation is part of accuracy because it prevents misreading.
-
Label every axis with units.
-
Use titles that state what the graph shows.
-
Add error bars where uncertainty matters.
-
Use short captions that interpret trends (not just describe the picture).
If you’re not sure what “good” looks like, calibrate your expectations using exemplars like this IB Math AA IA exemplar (coursework file).
Accuracy also means honesty: limitations and anomalies
A strong IA doesn’t hide awkward data points. It explains them.
Discuss:
-
measurement error sources,
-
uncontrolled variables,
-
sampling bias,
-
outliers (and whether you kept or excluded them, with justification),
-
and how these issues change confidence in your conclusion.
One warning: never “invent” cleaner data to make the story nicer. RevisionDojo breaks down the risk clearly in What If My IA Data Is Just AI-Generated Nonsense?.
Conclusion: make your IA trustworthy, then make it readable
A data-heavy IA becomes accurate when you treat accuracy like a process: design decisions, consistent collection, cautious analysis, and clear presentation. The goal is simple: make it hard for errors to enter, and easy for a reader to see your reasoning.
When you’re ready to tighten your draft, RevisionDojo helps you run the full loop: use Study Notes to clarify concepts, Flashcards to lock in methods, AI Chat to debug confusion, and the Grading tools to check rubric alignment. Pair that with Mock Exams, Predicted Papers, and Tutors for exam prep, and your IA stops being a stress object and starts being evidence of real skill.