
When you start an IA, it’s tempting to choose a side.
Some students cling to numbers because they feel safe. If it can be calculated, it must be correct.
Others lean on interpretation because it feels human. If it’s explained well, it must be convincing.
But the best-scoring IA rarely chooses one language. It translates between them.
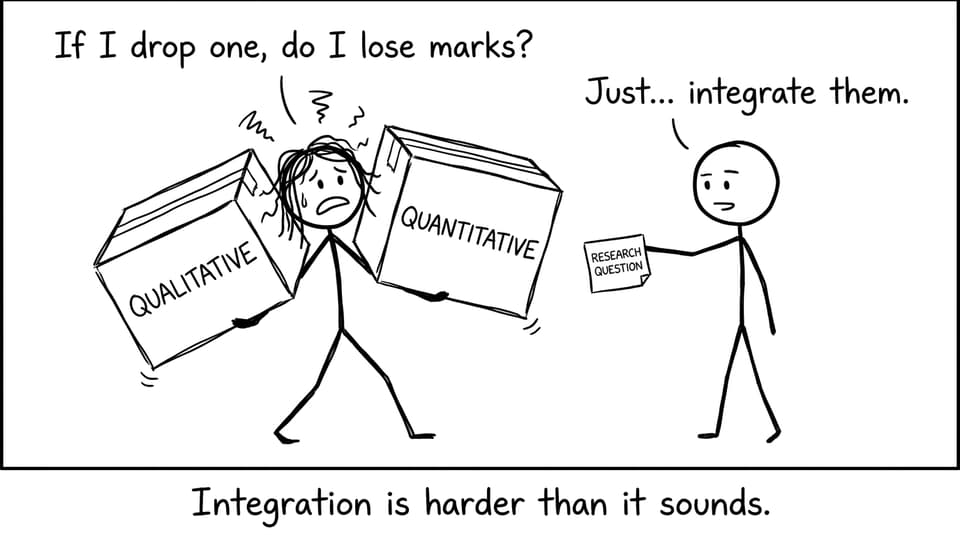
Quantitative data tells the examiner what happened. Qualitative data explains what it meant, what you noticed, and why your results deserve trust. The real skill is integration: making both types of evidence pull in the same direction, toward one clear research question.
A quick checklist for balancing data in an IA
Use this as a mini pre-flight check before you write another paragraph of your IA:
-
Do I have enough quantitative data to support a pattern (not just a single outcome)?
-
Do I have qualitative observations that explain conditions, context, or decision-making?
-
Does every table or quote connect back to the research question?
-
Have I clearly separated raw data vs processed data vs interpretation?
-
Have I acknowledged at least one limitation for each data type?
If you want to see how top students structure this balance, start by scanning IB Coursework Examples: IA, EE and TOK Exemplars.
What “quantitative” and “qualitative” actually mean in an IA
In an IA, the two categories are simple, but students often blur them.
Quantitative data is numerical. You measure it, count it, or calculate it. It’s the part that lets you use statistics, graphs, and modelling.
Qualitative data is descriptive. It captures meaning, context, and observations that numbers alone can’t carry. It’s the part that makes your method and evaluation feel credible, not mechanical.
The important detail: qualitative data is not “extra fluff.” In a strong IA, it is evidence that supports validity, controls, and interpretation.
For subject-specific expectations and rubric framing, browse IB IA Guides: Internal Assessment Structure, Rubrics & ....
Use quantitative data for precision (and examiner confidence)
A common reason IAs stagnate at the middle mark bands is that the quantitative side looks thin: too few trials, unclear uncertainty, or calculations without explanation.
Strong quantitative evidence in an IA usually includes:
-
Enough trials or datapoints to show variability
-
Clear units, uncertainties, and consistent precision
-
Processing that adds meaning (means, SD, correlation, regression, significance where appropriate)
-
Graphs that reveal relationships, not just decoration
If you’re not sure what “clean” presentation looks like, follow the structure in 10 Best Practices to Write Up Data and Results in Your IB IA.
For sciences, you can also model your analysis language on guidance like 2.2 Data analysis - Revision Dojo.
Use qualitative data for depth (and to protect your argument)
Here’s the uncomfortable truth: examiners don’t just mark results. They mark judgement.
Qualitative evidence is where your judgement lives.
In a strong IA, qualitative data often appears as:
-
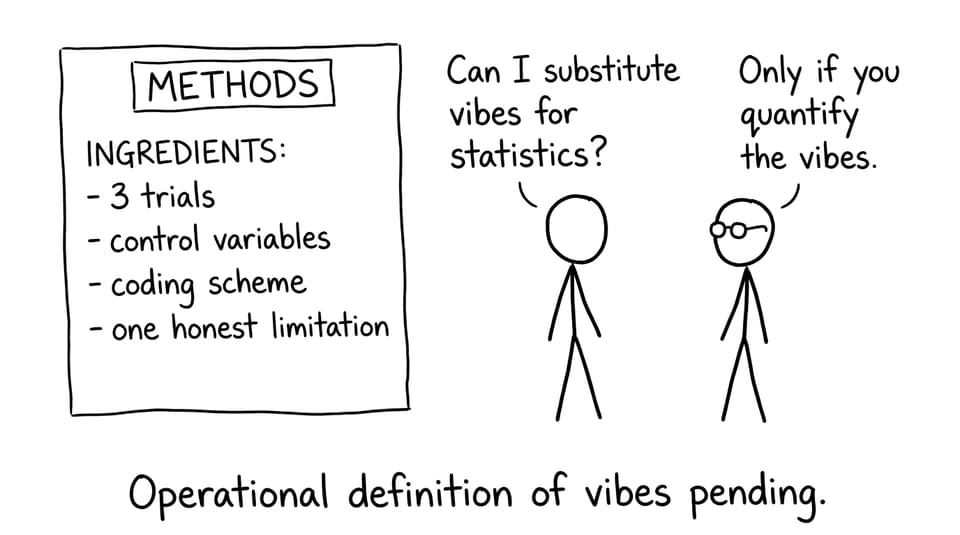
Controlled-variable notes (what stayed constant, what drifted, what you corrected)
-
Observations of anomalies (what looked off, what you did about it)
-
Context for sources (why a source is reliable, what bias may exist)
-
Process rationale (why you chose this method, sample, or coding scheme)
Think of it like this: quantitative data is your map, qualitative data is your weather report. A perfect route means little if you ignore the storm.
If your project involves surveys, questionnaires, or mixed-method datasets, Managing Large Datasets in Your Internal Assessment (IA) is a practical companion.
The integration method: “numbers first, meaning second” (repeat)
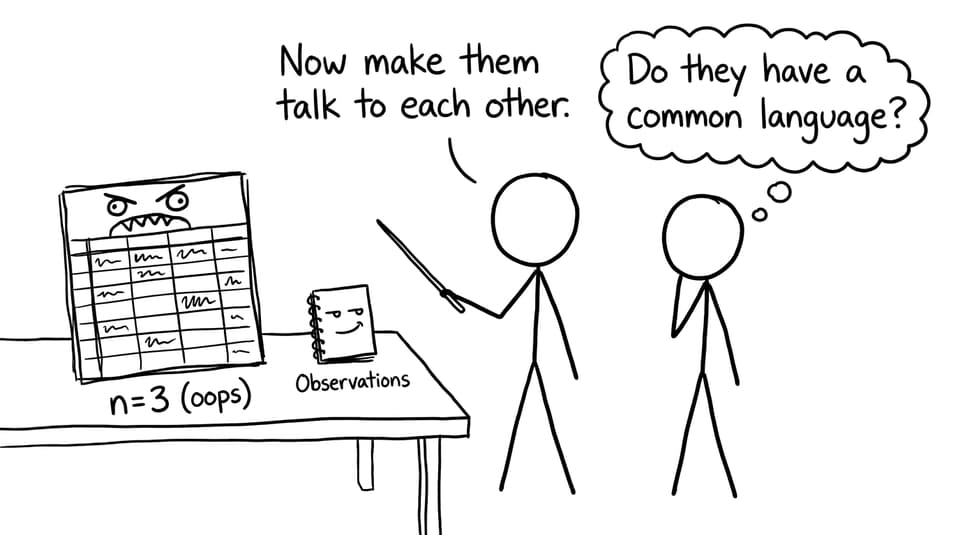
Most students separate the two data types by accident: they put numbers in one section and opinions in another, hoping the examiner stitches it together.
Instead, use a repeating pattern throughout your IA:
Quantitative claim
State the numeric pattern clearly.
Qualitative explanation
Add the observation or context that makes that pattern believable.
Link to the research question
Say what the pattern implies for your question.
Example rhythm (science-style):
-
Quantitative: “The mean rate increased by 18% across three trials.”
-
Qualitative: “However, the third trial showed visible bubbling earlier, likely because the water bath temperature drifted upward.”
-
Link: “This supports the hypothesis, but the temperature drift reduces certainty about causation.”
That last sentence is where marks are hiding: it’s analysis, not just calculation.
If you’re building a statistics-heavy argument, you’ll write more cleanly after reading How to Explain Statistical Analysis in the IB Math IA.
Subject-specific balancing tips (without forcing a 50/50 split)
Balancing data in an IA does not mean equal volume. It means the right mix for your subject and question.
Sciences (Biology, Chemistry, Physics)
Lead with quantitative results: measurements, uncertainty, variability, and trends. Then use qualitative notes to defend reliability and validity (apparatus issues, environmental conditions, anomalies). If you need an exam-level benchmark, scan high-scoring examples like IB Biology IA Exemplars - Revision Dojo.
Psychology, ESS, Group 3 investigations
Often mixed-method by nature: your numbers show effects or relationships, while qualitative observations explain participant behavior, sampling limitations, and ethical constraints. Seeing structures in real student work helps: IB Psychology IA Examples is useful for calibrating how much explanation is “enough.”
Mathematics
Your IA can be primarily quantitative, but it still needs qualitative thinking: why the model fits, where it fails, and what assumptions cost you. If you’re modelling, How to Use RevisionDojo to Prepare for IB Math IA Data Analysis can keep your workflow rubric-aligned.
Common mistakes that quietly lower IA marks
-
Too few datapoints: a beautiful graph built on weak sampling is still weak.
-
Qualitative comments with no purpose: observations must support method, interpretation, or evaluation.
-
Two parallel stories: numbers in one lane, description in another, never meeting.
-
No limitations trade-off: examiners reward students who can say, “This strengthens X but weakens Y.”
A helpful mindset shift is to treat the rubric like your table of contents. For strategic planning, Which IA Has the Highest Average Score? is a strong reality check on what actually moves scores.
Closing: make your IA bilingual
A strong IA is bilingual: fluent in numbers and fluent in meaning.
Quantitative data gives your work structure and precision. Qualitative data gives it credibility and insight. When you integrate both, your analysis stops being a report and becomes an argument.
If you want to see what that integration looks like in real student work, explore IB Coursework Examples: IA, EE and TOK Exemplars. Then build your own workflow on RevisionDojo: practice exam skills with the Questionbank, tighten concepts with Study Notes and Flashcards, test yourself with Mock Exams and Predicted Papers, refine drafts with AI Chat and Grading tools, and borrow structure from the Coursework Library or support from Tutors.
Your IA doesn’t need more words. It needs better balance.