Question
SLPaper 1A
The graph shows a spirometer trace of oxygen consumption when breathing at rest and during exercise.
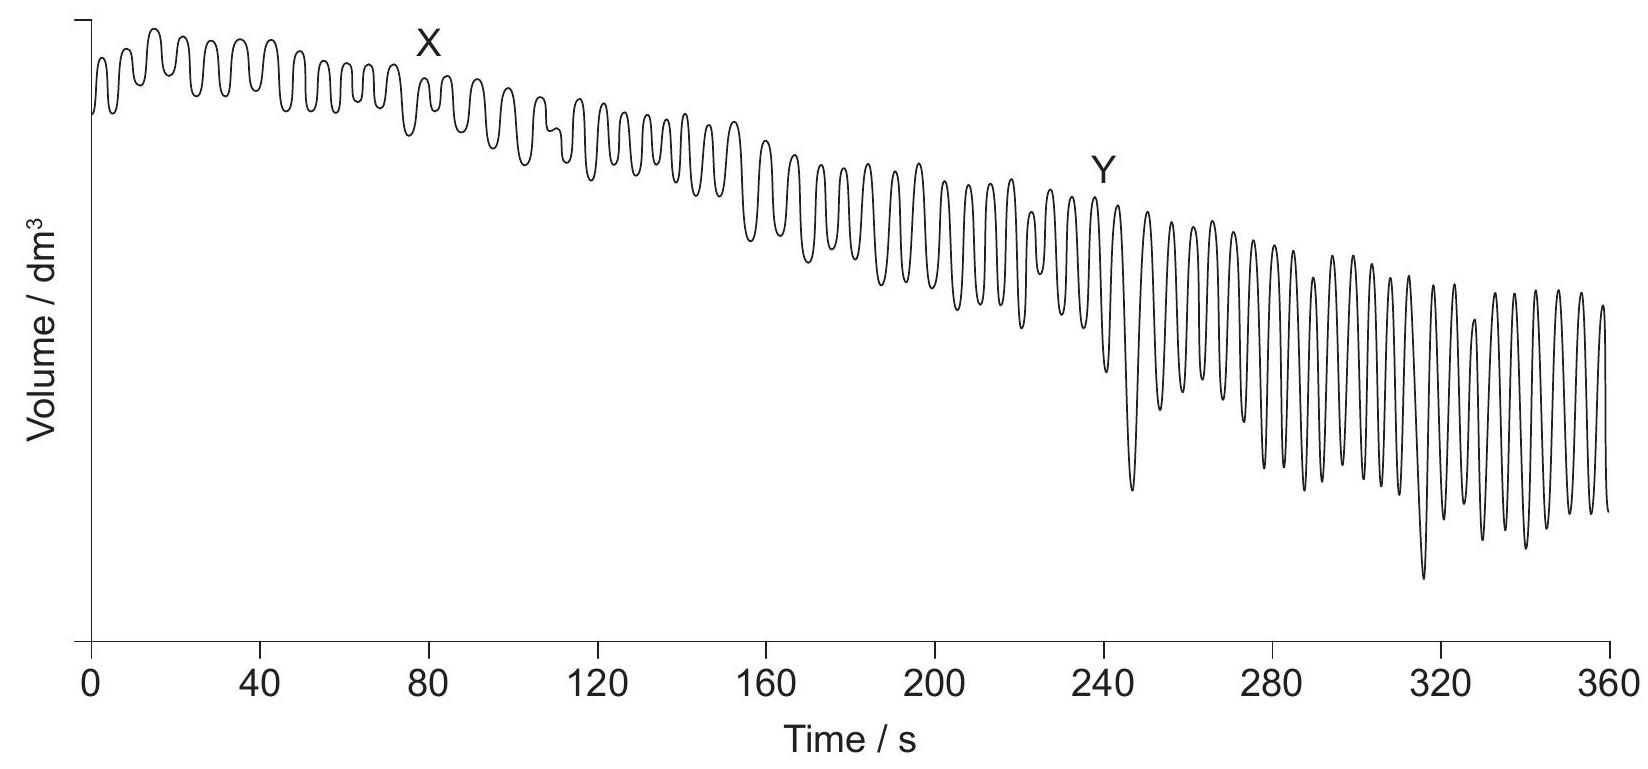
What explains the difference between the traces at regions X and Y on the graph?
The graph shows a spirometer trace of oxygen consumption when breathing at rest and during exercise.
What explains the difference between the traces at regions X and Y on the graph?

