A magnetized needle is oscillating on a string about a vertical axis in a horizontal magnetic field The time for 10 oscillations is recorded for different values of The graph shows the variation with B of the time for 10 oscillations together with the uncertainties in the time measurements. The uncertainty in B is negligible. 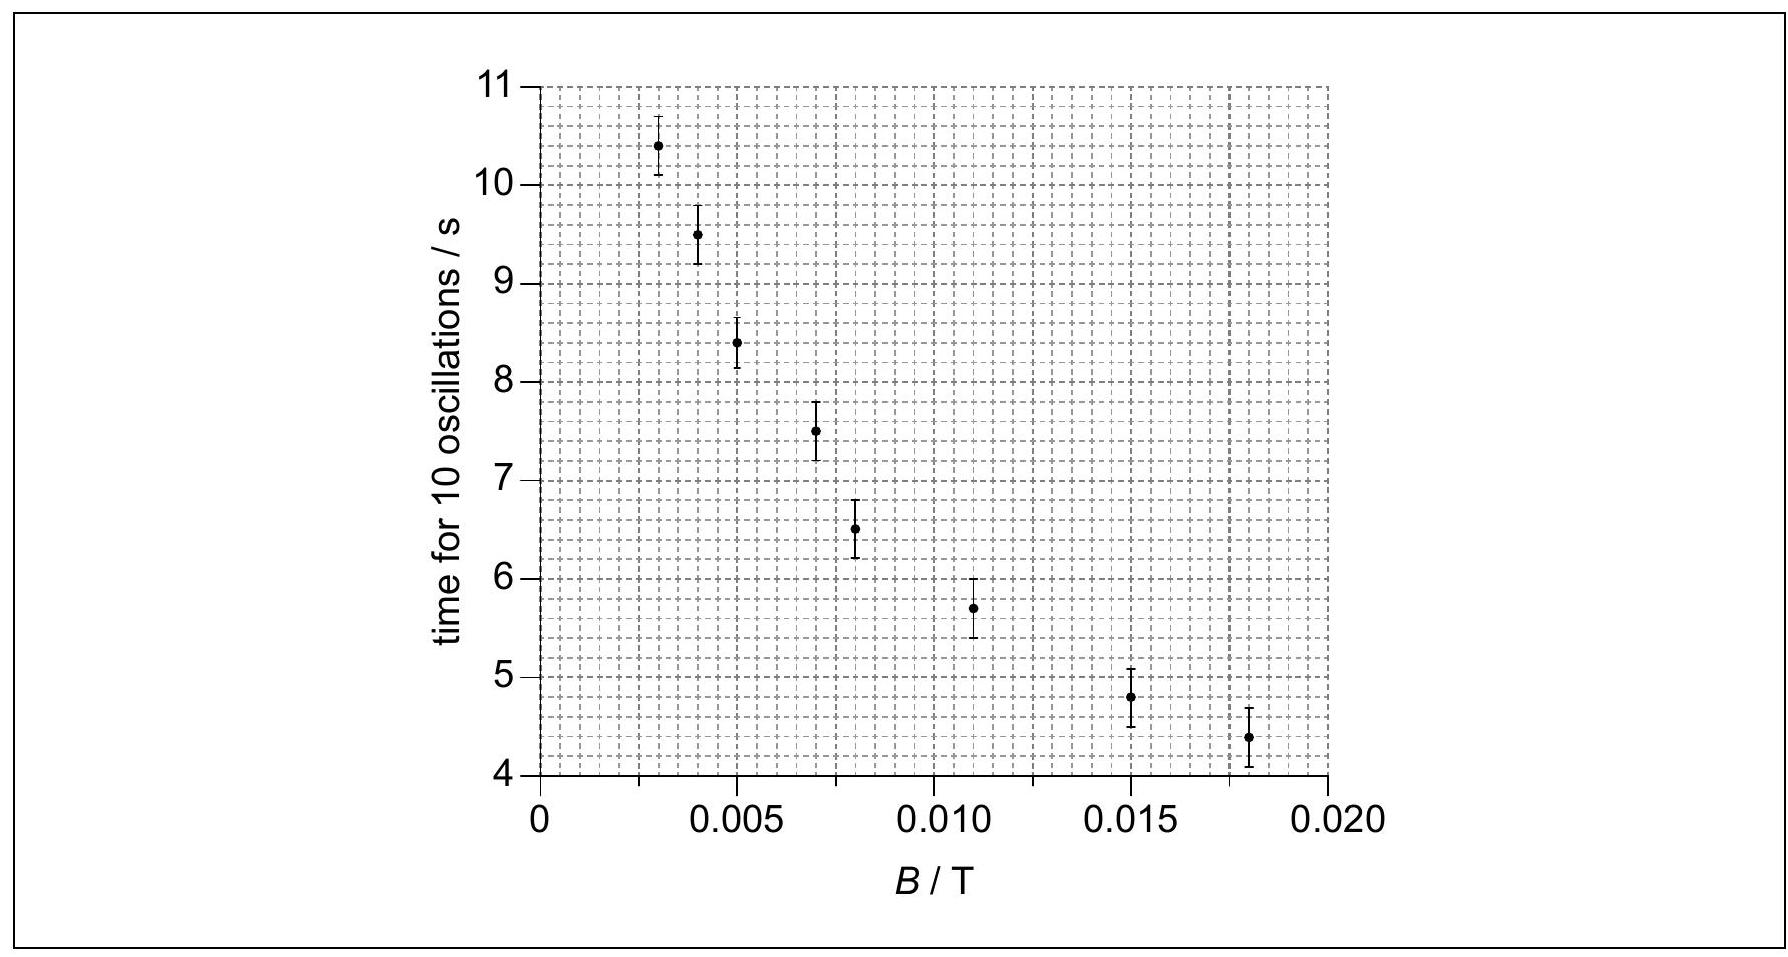
Draw on the graph the line of best fit for the data.
smooth line, not kinked, passing through all the error bars
Write down the time taken for one oscillation when B = 0.005 T with its absolute uncertainty.
«S» Accept any value from the range: 0.81 to 0.87 . Accept uncertainty 0.03 OR 0.025 .
A student forms a hypothesis that the period of one oscillation P is given by:
P = K/√B
where K is a constant.
Determine the value of K using the point for which B = 0.005 T.
State the uncertainty in K to an appropriate number of significant figures.
«S» Accept any value from the range: 0.81 to 0.87 . Accept uncertainty 0.03 OR 0.025 .
State the unit of K.
The student plots a graph to show how P² varies with 1/B for the data.
Sketch the shape of the expected line of best fit on the axes below assuming that the relationship P = K/√B is verified. You do not have to put numbers on the axes.

