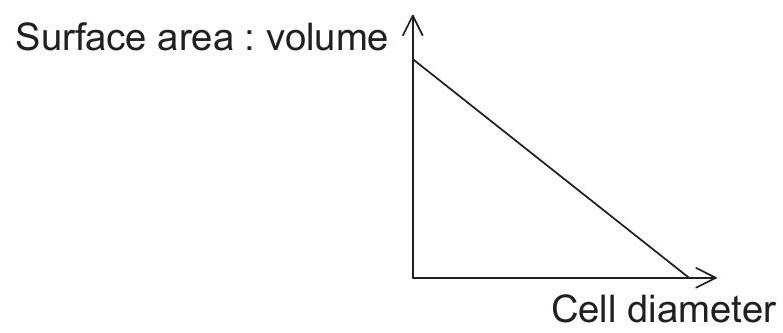
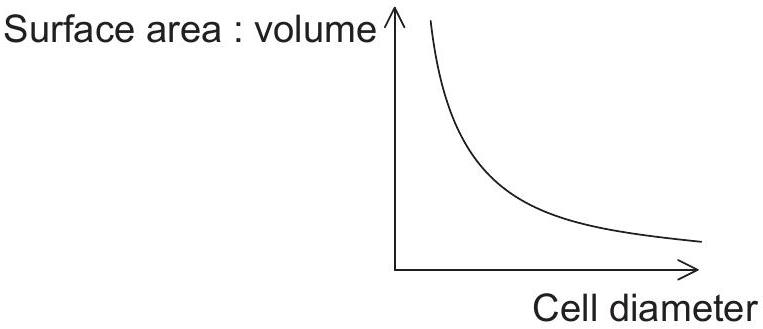
Question
SLPaper 1A
Which graph represents the change in cell surface area to volume ratio with increasing cell diameter?
A.
B.
C.
D.
A
A
B
B
C
C
D
D
Which graph represents the change in cell surface area to volume ratio with increasing cell diameter?
A.
B.
C.
D.
A
B
C
D
Want more practice questions for Biology?