Question
HLPaper 1A
The graph shows the activity of an enzyme at different temperatures.
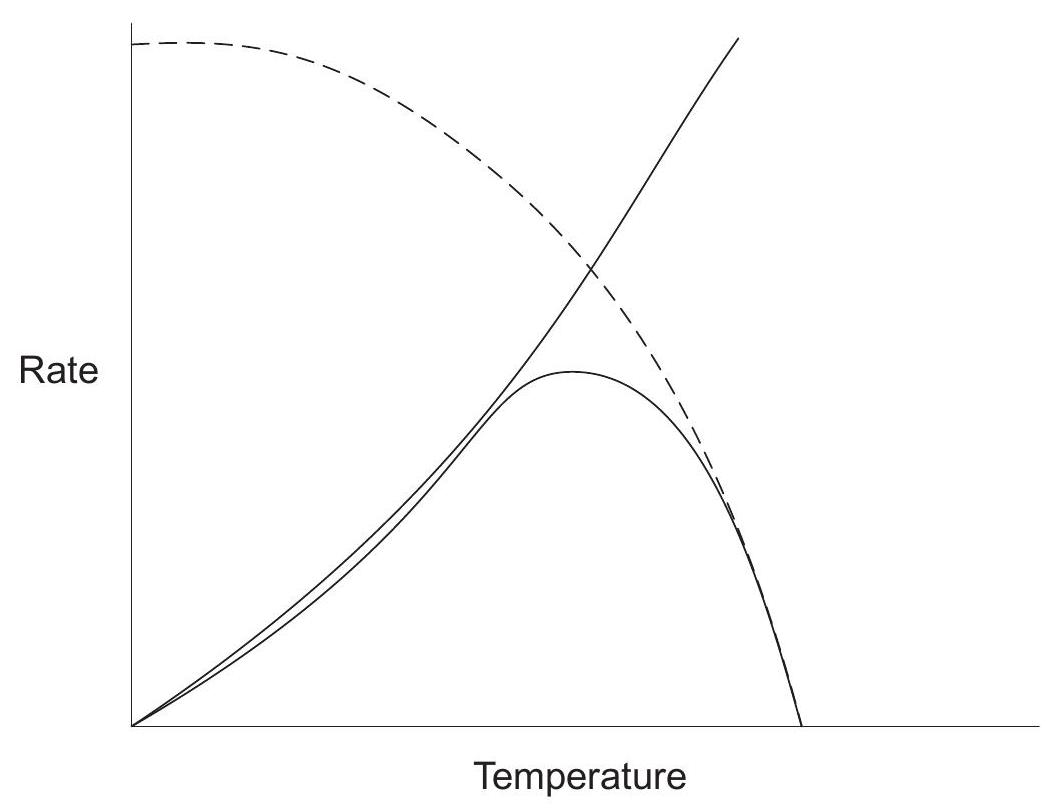
What does the dashed line in the graph represent?
The graph shows the activity of an enzyme at different temperatures.
What does the dashed line in the graph represent?

