Question
SLPaper 1A
The graph shows the incidence of trisomy resulting from non-disjunction in pregnancies at different maternal ages.
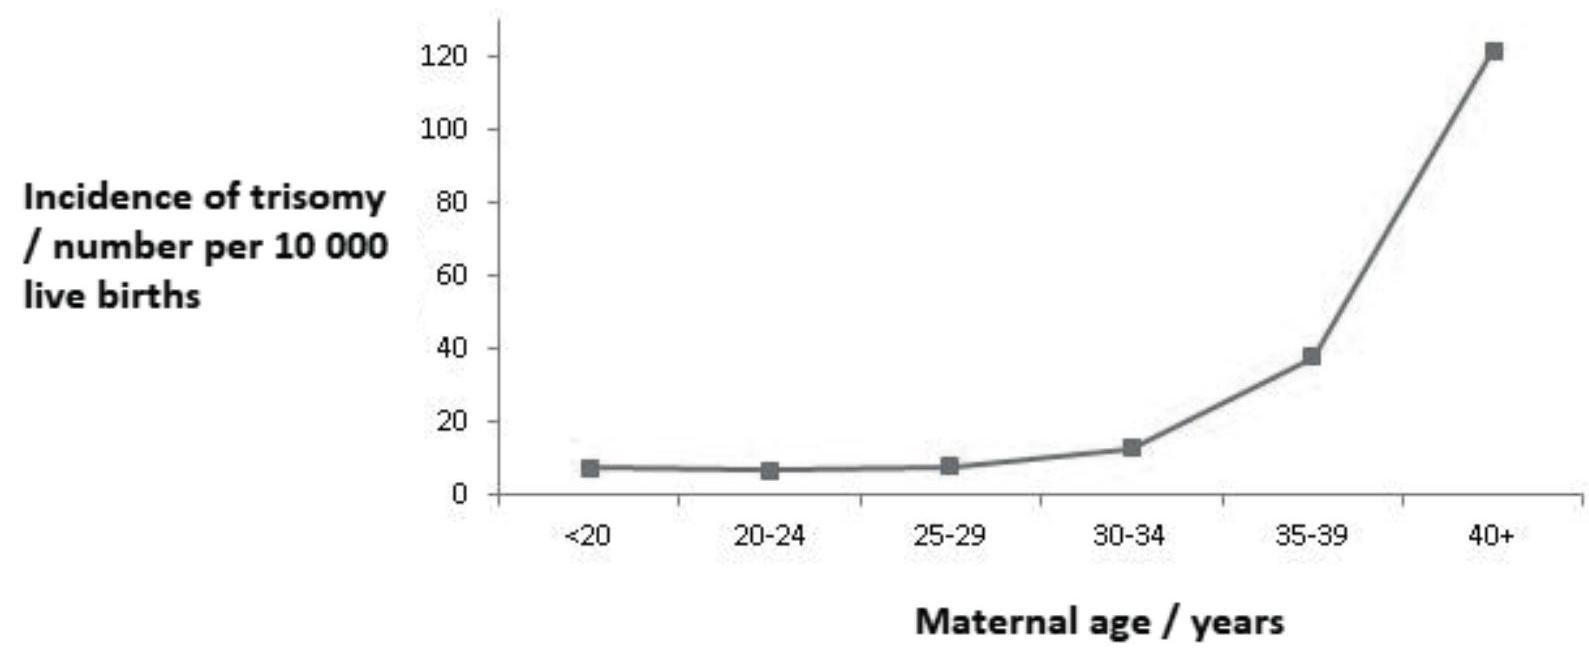
[Source: Center for Disease Control]
What can be inferred from the graph?
The graph shows the incidence of trisomy resulting from non-disjunction in pregnancies at different maternal ages.
[Source: Center for Disease Control]
What can be inferred from the graph?

