Question
View answerSLPaper 1ADemanding
The graph shows vertical displacement of the center of mass over 1 second for two gymnastics skills. Based on the graph, what does Skill B’s centre of mass trajectory indicate compared with Skill A?
Practice IB Sports, exercise and health science (SEHS) Topic B.2 Forces, Motion and Movement with authentic exam-style questions for both SL and HL students. This question bank focuses on the exact syllabus content for B.2 Forces, Motion and Movement and mirrors Paper 1A, 1B, 2 style where relevant.
Get instant solutions, detailed explanations, and build confidence with questions aligned to IB examiner expectations.
The graph shows vertical displacement of the center of mass over 1 second for two gymnastics skills. Based on the graph, what does Skill B’s centre of mass trajectory indicate compared with Skill A?
A tennis player practices serving toward an elevated platform, simulating pressure shots into corners of the court or elevated targets (Figure 1). Motion capture and performance analysis software were used to record flight trajectory, clearance height, and recovery time across different launch angles (Table 1). The aim was to understand how varying launch angles impact performance trade-offs, including net clearance, ball height, and time available for recovery.
Table 1: Performance Characteristics at Different Launch Angles
(e) why the thrower releases the javelin from a height of about 2.0 m rather than at ground level.
(f) why the optimal release angle for the javelin (34°) is less than 45°.
| Launch Angle (°) | Landing Height (m) | Flight Time (s) | Clearance Above Net (m) | Recovery Time (s) |
|---|
| 30 | 4.2 | 1.8 | 1.0 | 1.5 |
| 35 | 6.1 | 2.0 | 1.4 | 1.4 |
| 40 | 8.5 | 2.3 | 1.9 | 1.2 |
| 45 | 10.0 | 2.5 | 2.2 | 1.0 |
| 50 | 9.7 | 2.6 | 2.1 | 0.9 |
(a) Refer to Table 1. At which launch angle does the ball reach the maximum landing height?
(c) Using Figure 1, how the elevated target influences the required flight path compared to a flat-court shot.
(d) why increasing launch angle improves net clearance but may reduce tactical effectiveness in a fast-paced rally.
(e) Based on Table 1, why a 40° launch angle might be ideal for balancing both safety (net clearance) and recovery time.
(f) how understanding projectile motion can influence training strategies and shot selection in high-performance tennis, with reference to both biomechanical efficiency and game context.
Using the graph of momentum before and after a collision on different surfaces, which surface shows the greatest decrease in momentum during the collision?
(a) Refer to Figure 1. the time interval during which the sprinter's acceleration is greatest.
(b) Refer to Figure 1. the trend in velocity and what this indicates about the sprinter's acceleration.
(c) Using Newton's second law (F = ma), why the net horizontal force on the sprinter must have decreased over the 1-second period.
(d) Refer to Table 1. how impulse determines the change in the sprinter's velocity during the start phase.
(a) Using the figure, the relationship between release speed and range.
(b) Using the figure, the thrower increases her release speed by 10%. the approximate percentage increase in range.
(c) Using the table, the horizontal component of the release velocity. (horizontal velocity = release speed × cos(release angle))
(d) Using your answer to the last question and the flight time, the horizontal distance the javelin travels.
Skill B reached a higher peak centre of mass displacement, indicating a greater vertical take-off velocity/impulse
Skill A demonstrates superior technique due to reduced energy expenditure
Skill B shows reduced flight time and greater control in rotational phases
Skill A maintains longer aerial time, indicating better stability and balance
(b) Refer to Table 1. the relationship between launch angle and recovery time, and what this suggests about performance trade-offs.
A sports science lab analysed the first second of the sprint start for an elite 100 m sprinter of mass 80 kg. A force plate and motion capture recorded the sprinter's horizontal velocity and the net horizontal force acting on them every 0.2 s. The data are shown in Figure 1 and Figure 2. The impulse for each 0.2 s interval was calculated as the area under the force–time graph, and is shown in Table 1.
Figure 1: Horizontal velocity of the sprinter over the first second
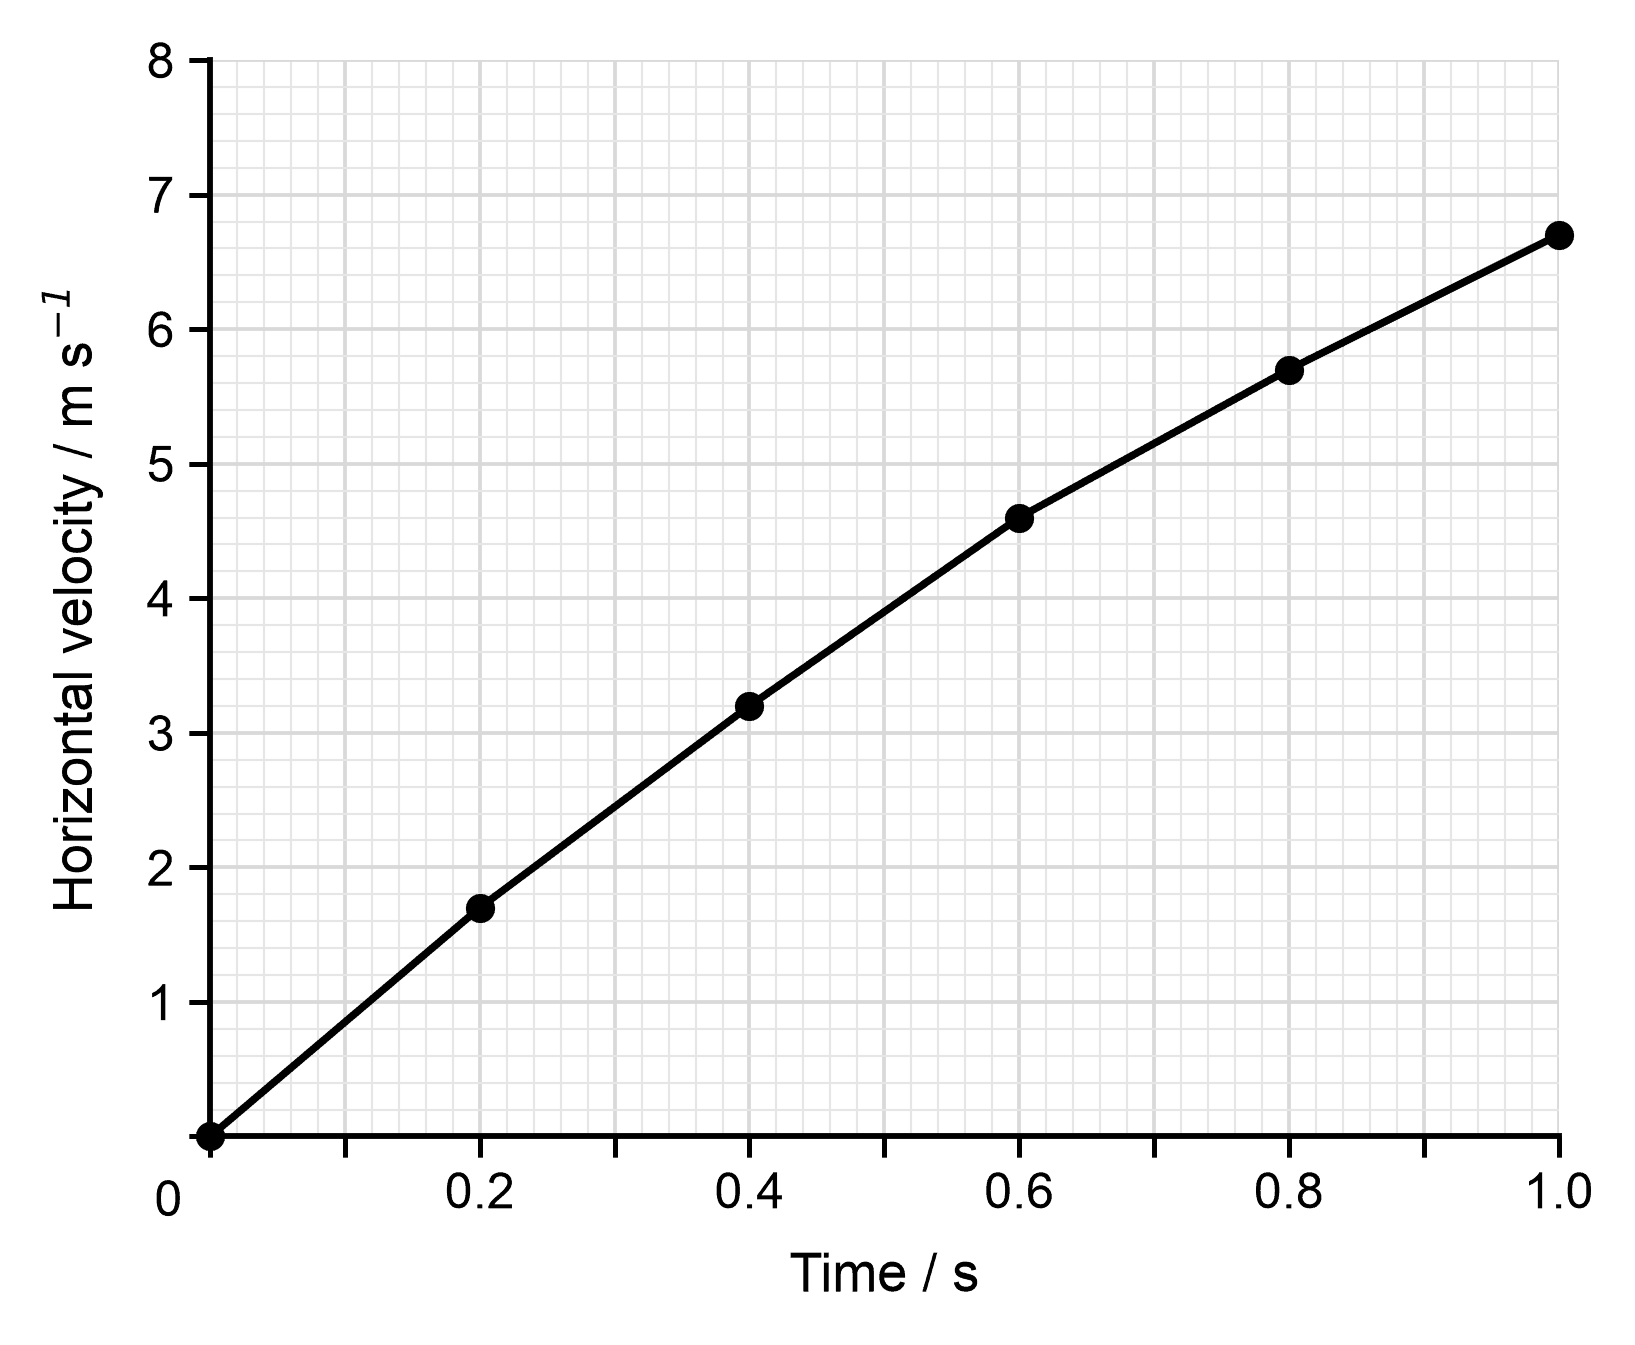
Figure 2: Net horizontal force on the sprinter over the first second
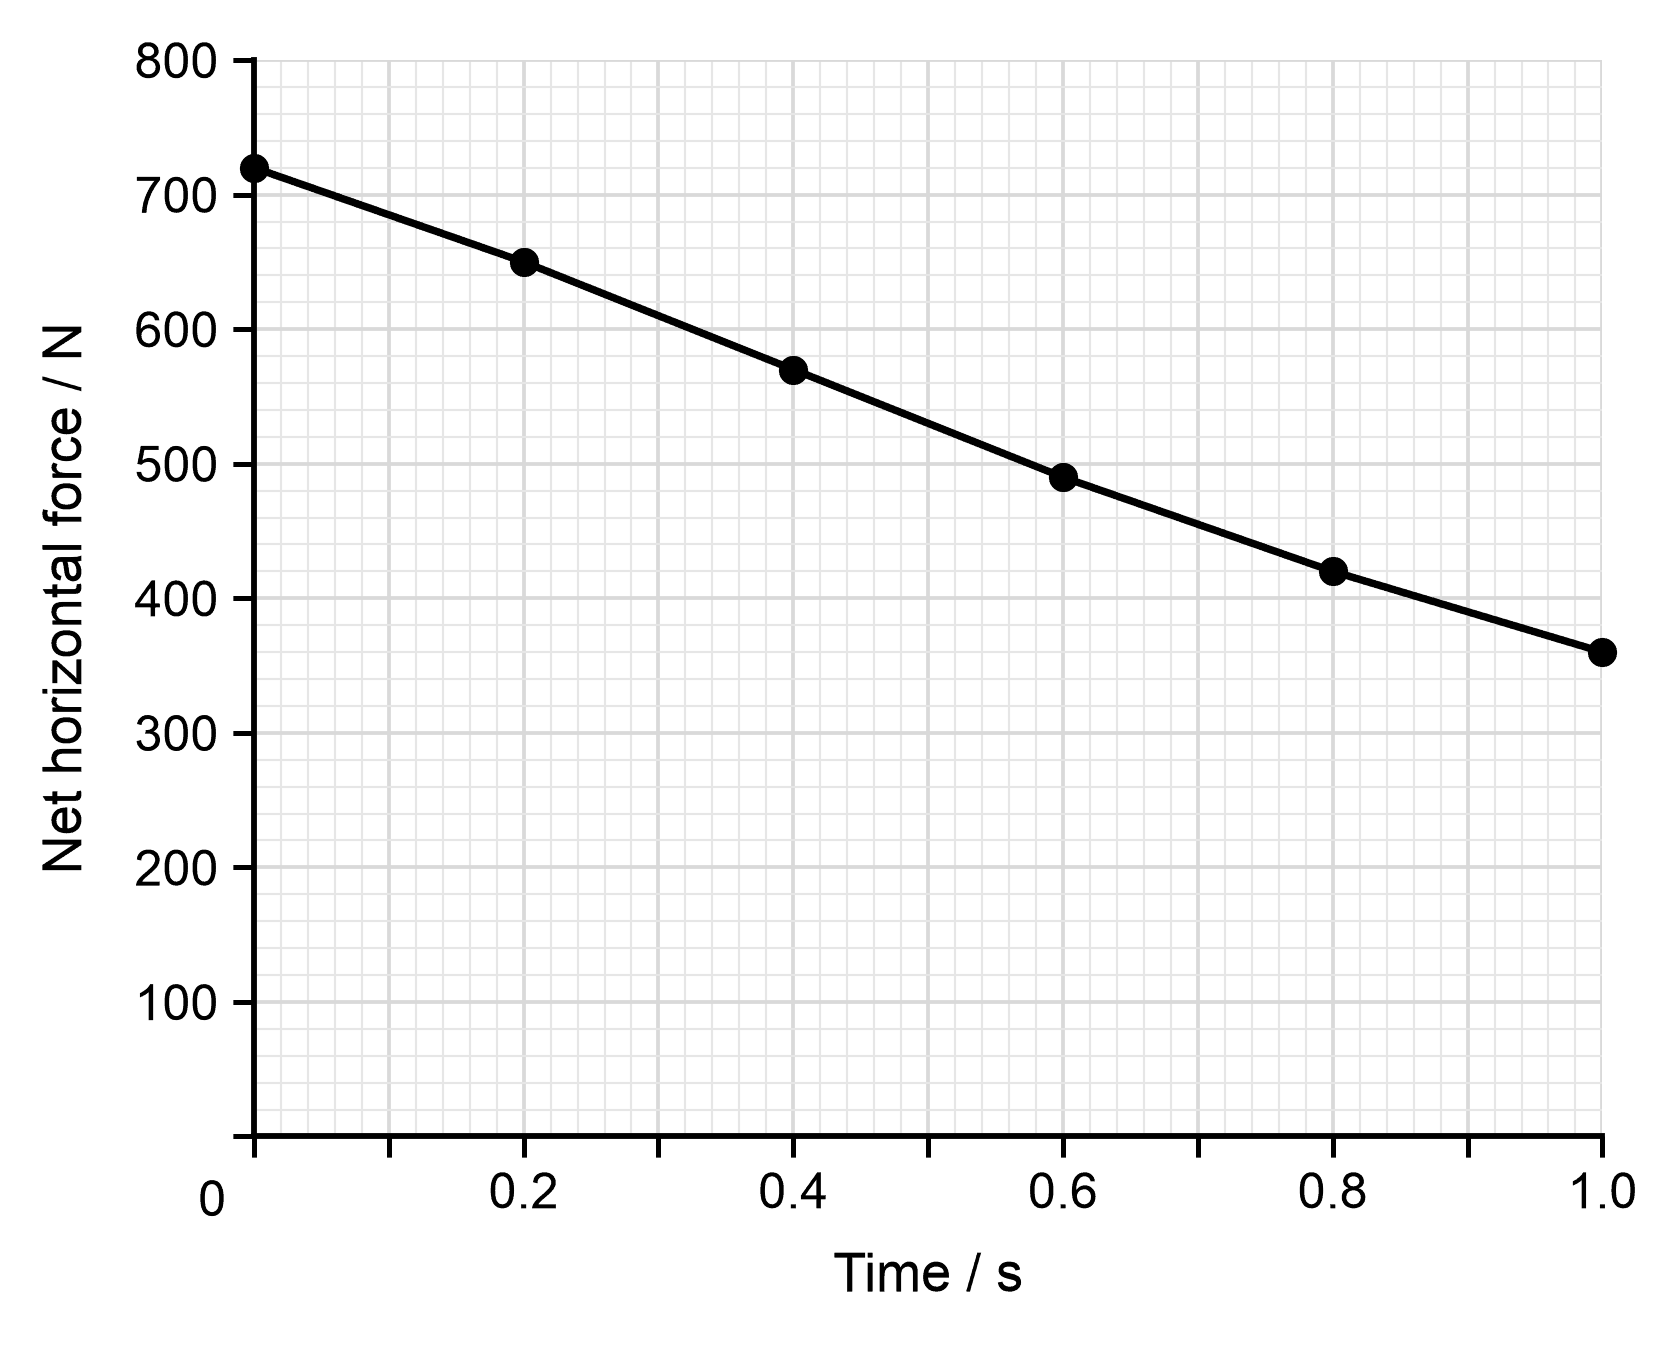
Table 1: Impulse during each 0.2 s interval
| Time interval / s | Impulse / N s |
|---|---|
| 0.0–0.2 | 137 |
| 0.2–0.4 | 122 |
| 0.4–0.6 | 106 |
| 0.6–0.8 | 91 |
| 0.8–1.0 | 78 |
A javelin thrower is analysing her technique with her coach. The figure shows how the range of a projectile depends on its release speed, when it is thrown at a fixed angle. Table 1 shows data recorded from one of her throws.
Figure: Range against release speed
Table: Data from one of her throws
| Quantity | Value |
|---|---|
| Release speed | 28 m s⁻¹ |
| Release angle | 34° |
| Release height | 2.0 m |
| Mass of javelin | 0.80 kg |
| Flight time | 3.2 s |
