Practice SL 4.2—Histograms, CF graphs, box plots with authentic IB Mathematics Analysis and Approaches (AA) exam questions for both SL and HL students. This question bank mirrors Paper 1, 2, 3 structure, covering key topics like functions and equations, calculus, complex numbers, sequences and series, and probability and statistics. Get instant solutions, detailed explanations, and build exam confidence with questions in the style of IB examiners.
Consider the data set .
Calculate the mean of the data set.
Determine the median of the data set.
Find the lower and upper quartiles of the data set.
Identify any outliers in the data set using the interquartile range (IQR).
100 people were asked what is the maximum they would be willing to spend on salt ranging from dollar to dollars. The data collected has the following summary statistics: minimum value = , first quartile () = , median () = , third quartile () = , and maximum value = .
Draw the box plot for the given data.
Interpret the box plot in the context of the data.
40 students took a standardized test to see where they landed on a scale from 0 to 100. The frequency distribution of their scores is given below.
Calculate the mean score of the students.
Draw a histogram representing the frequency distribution of the test scores.
Explain what the mean score indicates about the class's performance compared to the scale of the standardized test.
From the bottom two grade intervals, 10 students were removed from the class, and the average became 48. Determine how many students were removed from each interval.
The data set of test scores ranging from 1 to 50 is
Create a histogram representing the data in 5 equal class intervals.
What is the modal class of the histogram?
Calculate the mean of the data set.
A person creates a new measurement, called the Market Manipulation Score (MMS), to check how influential certain firms are in the market. The data can be seen in the box and whisker plot below.
It is given that the relationship between the median (), the upper quartile () and the maximum value () is as follows . If the range is 266, find the values of and .
Assume that you have pieces of paper with the names of all firms on them. From a bowl you randomly select one. What is the probability that it has an MMS below 4 or above ?
Now assume everytime you select one piece of paper, you read the MMS and put it back into the pile such that the probabilities stay the same throughout. If you are to do this 3 times, what is the probability that you get an MMS score above at least once.
A factory monitors lifetimes (hours) of rechargeable batteries. Lifetimes are approximately normal.
A supervisor draws Sample A of 100 batteries taken from a single shift and summarizes them:
| Lifetime ( h) | ||||||
|---|---|---|---|---|---|---|
| Frequency () | 6 | 11 | 25 | 31 | 21 | 6 |
Independently, Sample B is planned by taking 10 batteries at random at the end of each of 10 consecutive days (total 100).
For Sample A, use mid-interval values to estimate the mean and standard deviation of the lifetimes.
For Sample A, construct a cumulative-frequency table and estimate the median, , and IQR (linear interpolation within classes).
Use to find outlier bounds and decide if outliers are expected in Sample A.
Give two reasons why Sample B should estimate the population mean more reliably than Sample A.
51 Students are playing hide and seek, where 1 is seeking. The other 50 go hide within 100 metres. The distribution of distances is given in the table.
Calculate the mean distance of the students hiding.
The seeker has to catch the same number of people from each class interval. If you get caught, you are out. The seeker caught people from each interval such that the mean distance of those who are still in the game is 40. Find .
Draw the histogram for those who are still in the game after the seeker has caught people from each interval.
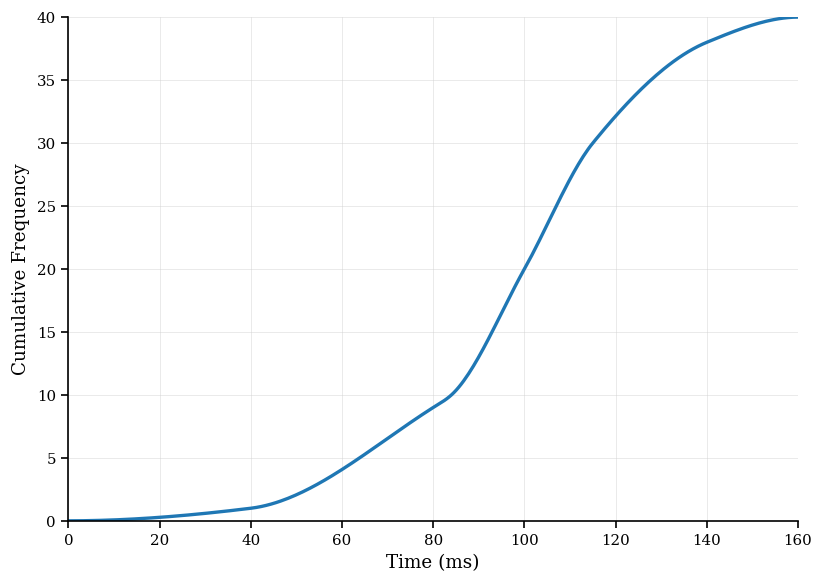
Multiple table tennis balls were tested in terms of time taken to fall from a small height. The data can be seen in the cumulative frequency diagram below.

Estimate the median time taken.
Estimate the interquartile range.
Given that of trials had a drop time slower than milliseconds, find the value of .
Create a frequency table with 4 equal class intervals and the appropriate frequencies.