Practice SL 4.10—X on y regression line with authentic IB Mathematics Analysis and Approaches (AA) exam questions for both SL and HL students. This question bank mirrors Paper 1, 2, 3 structure, covering key topics like functions and equations, calculus, complex numbers, sequences and series, and probability and statistics. Get instant solutions, detailed explanations, and build exam confidence with questions in the style of IB examiners.
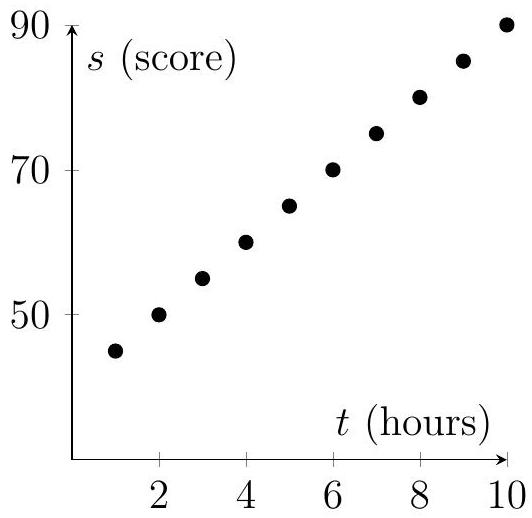
A dataset records study-hours and test scores for eight students:
(a) Using technology, find (i) ; (ii) the regression line ; (iii) the regression line . [5]
Using technology, find (i) ; (ii) the regression line ; (iii) the regression line .
Predict at and find the residual for .
Using on , estimate for ; then invert to estimate when . Explain the difference.
Compute and interpret; comment on extrapolating to .
A researcher collects data on the hours spent practicing a musical instrument, , and the performance score, , out of 100, for eight students.
| (hours) | 2 | 4 | 6 | 8 | 10 | 12 | 14 | 16 |
|---|---|---|---|---|---|---|---|---|
| (score) | 50 | 60 | 65 | 70 | 75 | 80 | 85 | 90 |
Let be the regression line of on , given by . Let be the regression line of on .
Find the values of and .
Both lines intersect at the mean point ( ). Calculate and .
A student practiced for 9 hours. Estimate their performance score using an appropriate regression line.
A café records the daily temperature, , and the number of coffees sold, , over seven days.
| 15 | 18 | 20 | 22 | 25 | 28 | 30 | |
|---|---|---|---|---|---|---|---|
| 60 | 55 | 50 | 45 | 40 | 35 | 30 |
Let be the regression line of on , given by .
Find the values of and .
Estimate the temperature when 42 coffees are sold.
A school records the time spent on homework, hours, and test scores, , for ten students. The regression line of on is . The regression line of on is .

Find the mean time spent on homework, .
A student scores 72 on the test. Estimate their homework time using an appropriate regression line.
Comment on the validity of using the regression line of on to predict the score for a student who spent 12 hours on homework.
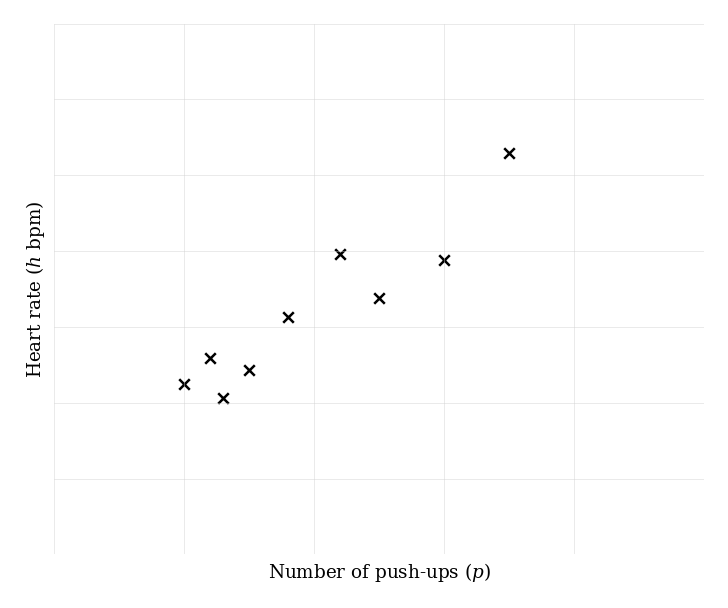
A gym tracks the number of push-ups, , and the heart rate, beats per minute, of nine members after a workout.

The regression line of on is . The regression line of on is .
Estimate the heart rate for a member who does 38 push-ups.
Find the mean number of push-ups, .
On the grid above, sketch the regression line of on .
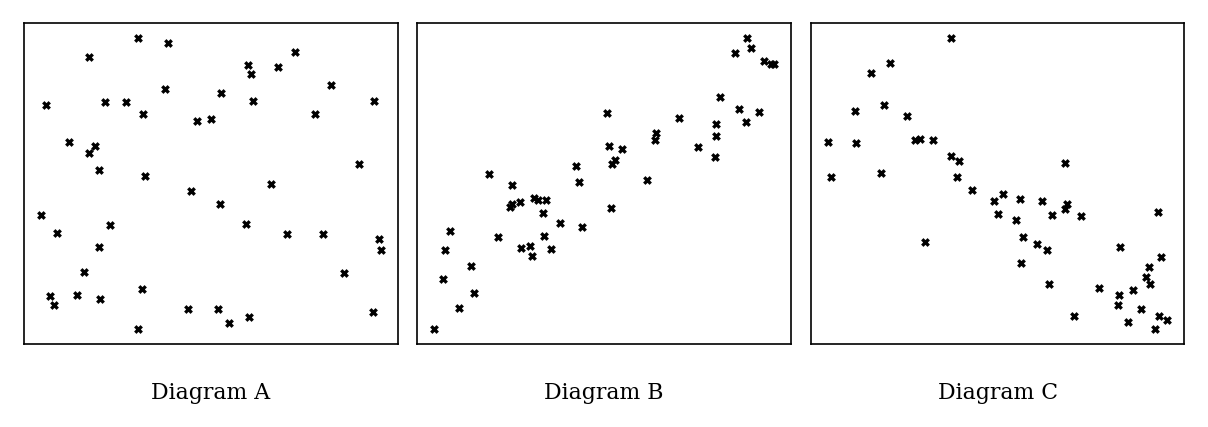
Three scatter diagrams (A, B, C) show relationships between variables , and over time in an experiment.

Identify which diagram shows (i) no correlation, (ii) strong positive correlation, (iii) strong negative correlation.
Given correlation coefficients: , assign the appropriate coefficient to each diagram and explain why is rejected.
The table below shows the number of hours, , a group of six students spent on homework and their corresponding test scores, , out of 100 .
| (hours) | 1 | 3 | 5 | 7 | 9 | 11 |
|---|---|---|---|---|---|---|
| (score) | 40 | 55 | 60 | 70 | 80 | 85 |
Let be the regression line of on , given by .
Calculate the values of and .
Let be the regression line of on . Both lines intersect at the point . Find the values of and .
A researcher investigates the relationship between weekly screen time, hours, and academic performance, (GPA out of 4.0), for 12 university students. The data follows a bivariate normal distribution.
| (hours) | 10 | 15 | 20 | 25 | 30 | 35 | 40 | 45 | 50 | 12 | 18 | 28 |
|---|---|---|---|---|---|---|---|---|---|---|---|---|
| (GPA) | 3.8 | 3.5 | 3.2 | 3.0 | 2.8 | 2.5 | 2.2 | 2.0 | 1.8 | 3.6 | 3.4 | 2.9 |
Calculate Pearson's product moment correlation coefficient, , and interpret its value in context.
Find the equation of the regression line of on .
A stratified sample of 6 students is to be selected, proportional to screen time categories: low ( hours), medium ( hours), and high ( hours). Determine the number of students from each category.
Estimate the GPA of a student with 22 hours of screen time, and comment on the reliability of this estimate.
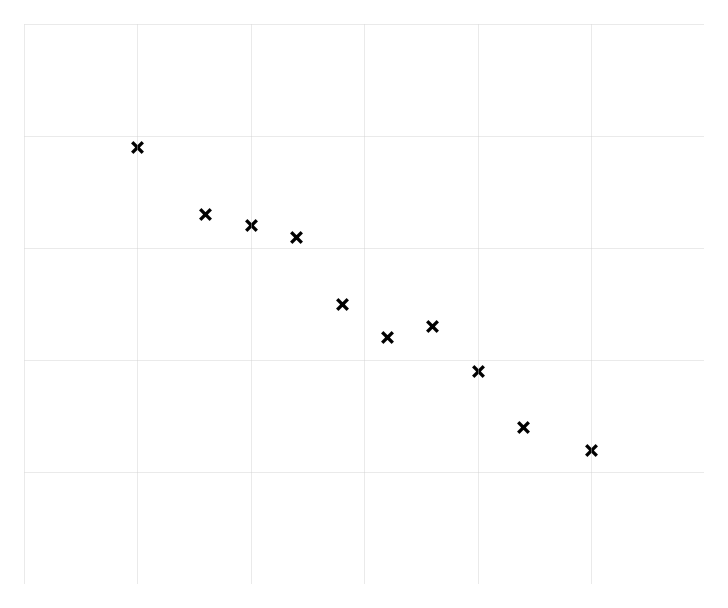
A sports scientist studies the relationship between training hours per week, , and sprint times, seconds, for 10 athletes. The data is shown in the table below.
| (hours) | 5 | 8 | 10 | 12 | 14 | 16 | 18 | 20 | 22 | 25 |
|---|---|---|---|---|---|---|---|---|---|---|
| (seconds) | 12.9 | 12.3 | 12.2 | 12.1 | 11.5 | 11.2 | 11.3 | 10.9 | 10.4 | 10.2 |

Describe the relationship between and . Write down the coordinates of the mean point .
Find the equation of the regression line of on . Draw this line on a copy of the scatter diagram.
Find the equation of the regression line of on .
Estimate the sprint time for 17 training hours and the training hours for a 11.3 second sprint. Comment on the validity of each estimate.
A study examines the relationship between daily water intake, liters, and energy levels, (rated 1-10), for nine individuals.
| (liters) | 1.5 | 2.0 | 2.5 | 3.0 | 3.5 | 2.2 | 2.8 | 1.8 | 3.2 |
|---|---|---|---|---|---|---|---|---|---|
| (rating) | 4 | 5 | 6 | 7 | 8 | 5 | 7 | 4 | 8 |
Find the equation of the regression line of on .
A person drinks 2.7 liters of water. Estimate their energy level.