- IB
- Question Type 2: Constructing cumilative frequency graphs given the frequency distribution table
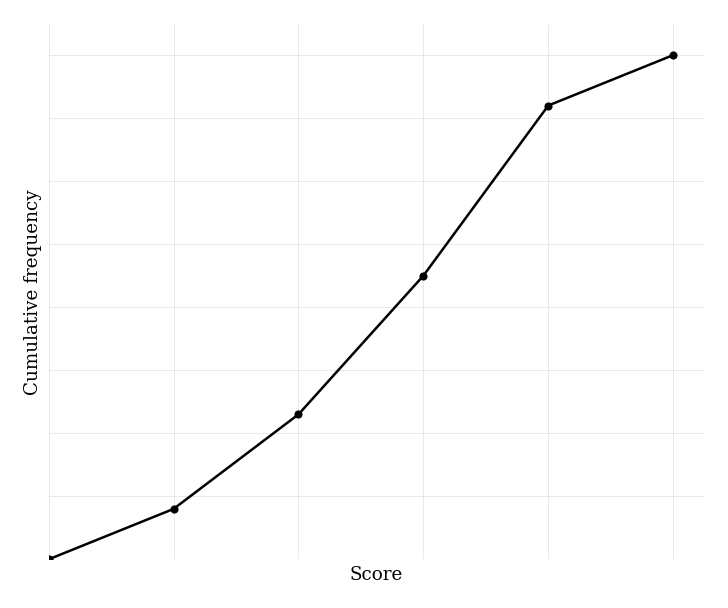
The cumulative frequency graph of test scores (out of 100) is summarized by the points below (upper class boundaries with cumulative frequencies). Use the graph to estimate the interquartile range (IQR).
The table below shows the data used to plot the ogive:
| Class interval | Upper boundary | Cumulative frequency |
|---|---|---|
| 0–20 | 20 | 8 |
| 20–40 | 40 | 23 |
| 40–60 | 60 | 45 |
| 60–80 | 80 | 72 |
| 80–100 | 100 | 80 |

A cumulative frequency graph for the weights (kg) of 60 packages is represented by the points below. Use it to construct the estimated frequency distribution table for each class interval.
Data (less-than ogive points):
| Class interval (kg) | Upper boundary | Cumulative frequency |
|---|---|---|
| 40–50 | 50 | 3 |
| 50–60 | 60 | 11 |
| 60–70 | 70 | 26 |
| 70–80 | 80 | 44 |
| 80–90 | 90 | 57 |
| 90–100 | 100 | 60 |
The lifetimes of 100 light bulbs (hours) are summarised by the cumulative frequency points below. Using the ogive, estimate the median lifetime.
Data (ogive points):
| Class interval (hours) | Upper boundary | Cumulative frequency |
|---|---|---|
| 500–600 | 600 | 5 |
| 600–700 | 700 | 18 |
| 700–800 | 800 | 40 |
| 800–900 | 900 | 68 |
| 900–1100 | 1100 | 100 |
The cumulative frequency of house prices (in thousands of dollars) is shown in the table below. Use it to construct the estimated frequency distribution table for the given classes.
Data (ogive points):
| Price () ($1000s) | Upper boundary | Cumulative frequency |
|---|---|---|
| 150 | 4 | |
| 200 | 12 | |
| 250 | 27 | |
| 300 | 41 | |
| 400 | 59 | |
| 600 | 80 |
The cumulative frequency data for exam scores is summarized in the table below. Use it to reconstruct the estimated frequency distribution table for the 10-mark wide classes.
Data:
| Class interval | Upper boundary | Cumulative frequency |
|---|---|---|
| 0–10 | 10 | 6 |
| 10–20 | 20 | 18 |
| 20–30 | 30 | 33 |
| 30–40 | 40 | 55 |
| 40–50 | 50 | 78 |
| 50–60 | 60 | 96 |
| 60–70 | 70 | 108 |
| 70–80 | 80 | 116 |
| 80–90 | 90 | 120 |
| 90–100 | 100 | 120 |