- IB
- E.2 Tourism and sport at the local and national scale
Practice E.2 Tourism and sport at the local and national scale with authentic IB Geography exam questions for both SL and HL students. This question bank mirrors Paper 1, 2, 3 structure, covering key topics like physical geography, human geography, and geospatial analysis. Get instant solutions, detailed explanations, and build exam confidence with questions in the style of IB examiners.
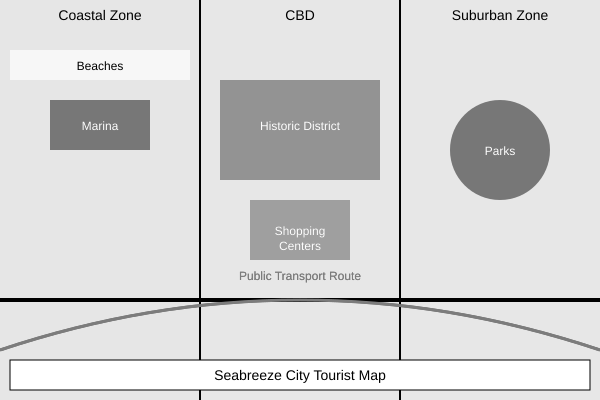
The diagram shows the distribution of tourist attractions in Seabreeze City.

Referring to the diagram, outline two differences you would expect to find between the coastal zone and the suburban zone in terms of tourist attractions.
Explain three reasons why it is important for city planners to ensure a balanced distribution of tourist attractions across Seabreeze City.
With reference to Seabreeze City, examine the factors that have influenced the location and distribution of tourist attractions.
The following graph shows the relationship between the number of leisure facilities and catchment areas across several major cities
State the city with the smallest catchment area
Identify the city with the lowest catchment to leisure facility ratio
Outline one reason why cities with smaller catchment areas might still have a high number of leisure facilities
Explain two factors that influence the number of leisure facilities in urban areas
Evaluate the relative importance of factors impacting the distribution of athletic facilities in at least one urban area.
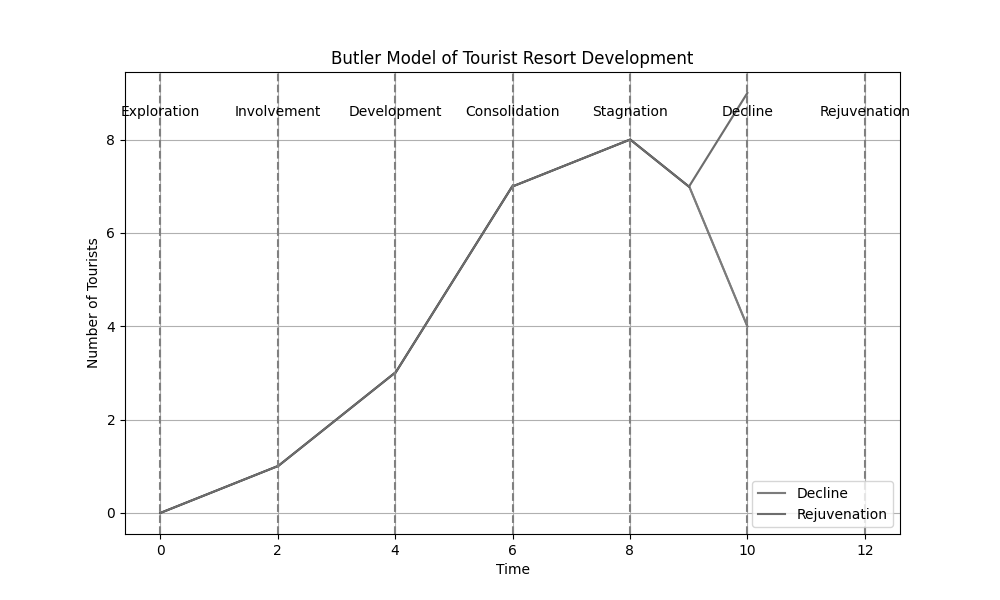
The diagram below shows the Butler Model of Tourist Resort Development.

Describe the main characteristics of the Exploration and Involvement stages in the Butler Model of Tourist Resort Development.
Explain the factors that lead to the Development stage in the Butler Model of Tourist Resort Development.
Using the Butler Model, analyze the potential outcomes for a tourist resort that has reached the Stagnation stage.
Evaluate the effectiveness of the Butler Model in predicting the life cycle of tourist resorts, using examples to support your argument.
The following table shows 5 cities with the highest number of international arrivals in 2024:
| City | Country | International Arrivals (millions) | Growth from Previous Year |
|---|---|---|---|
| Mecca | Saudi Arabia | 19.3 | +20% |
| Bangkok | Thailand | 32.4 | +37% |
| London | United Kingdom | 21.7 | +7% |
| Hong Kong | China (SAR) | 20.5 | +19% |
| Istanbul | Turkey | 23.0 | +14% |
State the number of international arrivals (in millions) to Mecca in 2024.
Identify the country with the highest number of international visitors
Outline two potential reasons why not every international arrival is considered tourism.
Describe two strategies used to manage environmental damage caused by tourism using one named example.
Examine the perspective that the economic benefits of tourism in one named country outweigh its social and environmental consequences.
Imagine a popular coastal tourist destination with various facilities and attractions. The area is experiencing issues related to environmental sustainability and carrying capacity.
Identify and describe two indicators that suggest the coastal tourist destination is experiencing environmental stress.
Explain how the concept of carrying capacity applies to the coastal tourist destination.
Discuss two management strategies that could be implemented to reduce environmental stress in the coastal tourist destination.
Evaluate the potential economic impacts of restricting tourist numbers at the coastal destination.
The following questions are based on a case study of ecotourism in the Galápagos Islands. The Galápagos Islands are known for their unique biodiversity and are a popular destination for ecotourism. The government and various organizations have implemented measures to promote sustainable tourism while preserving the natural environment.
Describe the main features of ecotourism in the Galápagos Islands.
Explain how ecotourism in the Galápagos Islands contributes to the conservation of biodiversity.
Discuss one potential negative impact of ecotourism on the Galápagos Islands and suggest a possible solution.
Analyze the role of local communities in the success of ecotourism in the Galápagos Islands.
Evaluate the overall effectiveness of ecotourism as a strategy for sustainable development in the Galápagos Islands. Support your answer with specific examples.
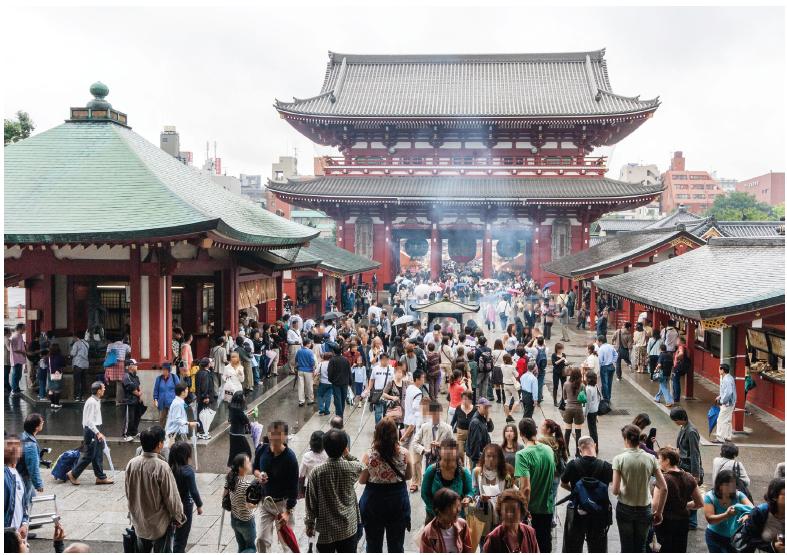
The photograph shows tourists at a popular site in Tokyo, Japan.

With reference to the photograph, identify one primary tourist attraction.
With reference to the photograph, identify one secondary tourist attraction.
Using photographic evidence, suggest why the perceptual carrying capacity of this sitemight have been reached.
For one named international sporting event, explain how one physical factor and two human factors influenced the choice of venue(s).
Examine the extent to which the aims of sustainable tourism might be achieved in two different environments.
The table shows the top 10 performers in the world by total medal count in the Olympics
Source: International Olympic Committee (IOC)
Calculate the range in total medal count among the top ten countries shown in the table.
Explain two ways that national success in international sports can contribute to:
i. Increased national pride or unity
Explain two ways that national success in international sports can contribute to
ii. Greater investment in sports infrastructure and training
Describe two possible geographical or economic factors that could explain why two countries would perform at the top of the medal table.
To what extent does success in global sporting events reflect a country’s level of development?
Discuss the role of government and private investment in influencing a nation’s success in international sporting competitions.
The following triangular graph shows changes over time in the percentage of South Korean citizens, from three different age groups, who play football
Identify the age group with the highest percentage of football players in 2024.
State the trend in participation among children from 2004 to 2024.
Outline one possible reason why older adults in South Korea may have lower levels of football participation.
Explain two reasons for the increasing popularity of football among younger age groups in South Korea.
Examine the role that age structure and lifestyle trends play in shaping sports participation rates over time.
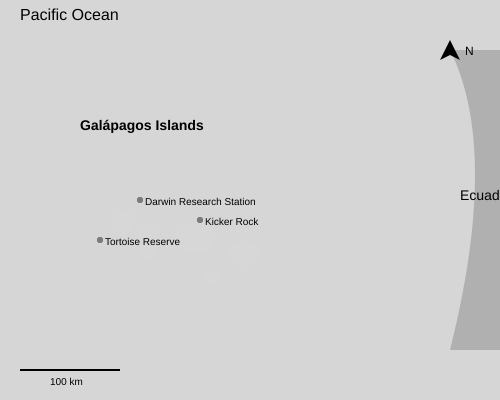
The map shows the location of the Galápagos Islands, a well-known ecotourism destination.

Discuss two positive impacts of ecotourism on the local communities in the Galápagos Islands.
Describe the location of the Galápagos Islands and explain why this location is significant for ecotourism.
Identify and explain two challenges that ecotourism poses to the environment of the Galápagos Islands.
Evaluate the effectiveness of current measures in place to manage ecotourism in the Galápagos Islands.