Practice C.5 Population ecology with authentic IB Biology exam questions for both SL and HL students. This question bank mirrors Paper 1A, 1B, 2 structure, covering key topics like cell biology, genetics, and ecology. Get instant solutions, detailed explanations, and build exam confidence with questions in the style of IB examiners.
Paper
Level
Question 1
HLPaper 1A
In 1789 Gilbert White, a naturalist, observed eight breeding pairs of swifts (Apus apus) in the English village of Selborne. On average, each pair of swifts produces two offspring per year. This would allow the population to rise to 1030 swifts over 200 years. A bird survey carried out in 1983 revealed only 12 breeding pairs in this village.
What could have prevented the numbers rising to 1030?
I. The number of nesting sites remained the same.
II. The food supply of the swifts remained constant.
III. Predatory birds in the area were exterminated.
Question 2
SLPaper 2
Near the middle of pregnancy in humans, the placenta begins to secrete a hormone called corticotrophin-releasing hormone (CRH). CRH influences the production of hormones which stimulate the development of the fetus. A study was carried out to determine if levels of CRH were correlated with the timing of the baby's delivery. Blood samples were taken from 500 women during their pregnancies and the concentration of CRH was measured. The women were then divided into three groups according to whether their baby was delivered prematurely, at full-term (about 40 weeks) or late. The graph below shows how the concentration of CRH varied in the mothers' blood (maternal blood) in each of the three groups during pregnancy. 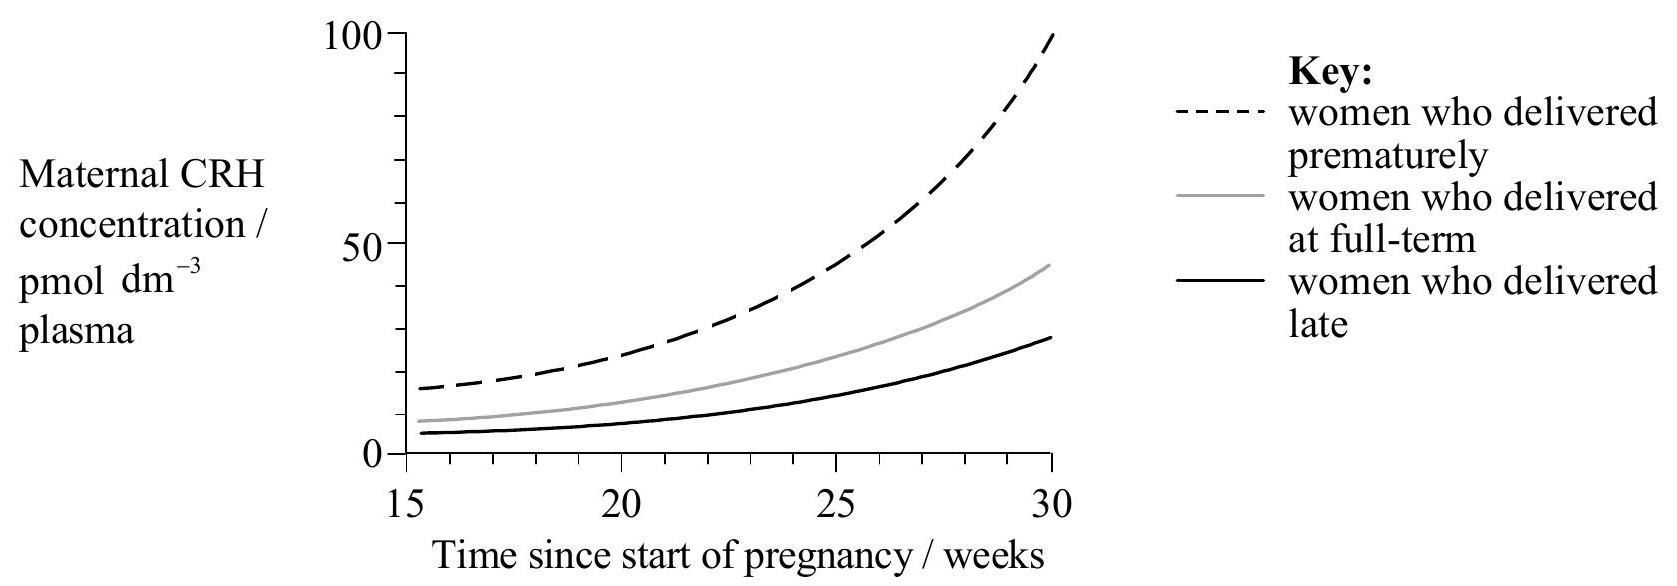
1.[2]
Outline how the concentration of CRH in the blood changes during the pregnancies of women who delivered prematurely.
2.[2]
Compare how the concentration of CRH changes during the pregnancies of women who delivered late with those that delivered at full-term.
3.[1]
Measure the difference in CRH concentration at 30 weeks between the women who delivered prematurely and those that delivered at full-term.
4.[2]
Suggest how knowledge of the CRH concentration in maternal blood might be used by doctors monitoring pregnancies.
5.[2]
Suggest how undergoing metamorphosis at different times in response to water levels helps the survival of the toad.
6.[2]
Compare the concentrations of thyroxine and corticosterone in the two groups.
7.[1]
Predict how the concentration of CRH would be different in the two groups.
Question 3
HLPaper 1A
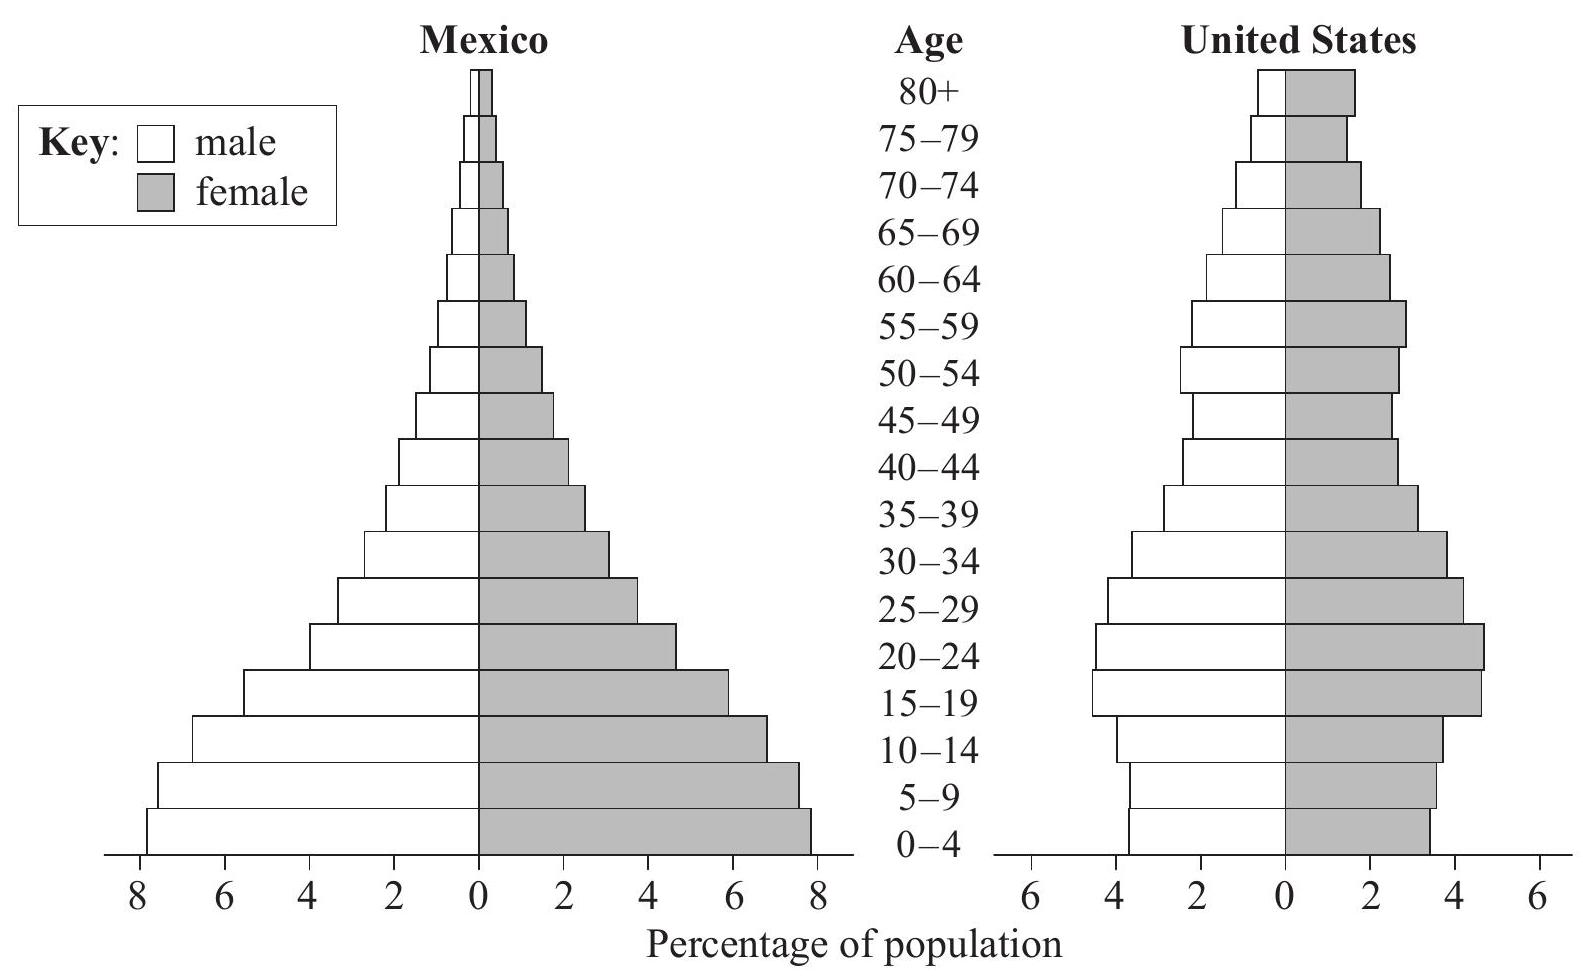
What do the graphs below show?
Question 4
SLPaper 1A
Global warming threatens the survival of Arctic foxes. Which of the following factors could be involved?
I. Competition with other fox species spreading north
II. Reduction in numbers of prey species of Arctic foxes
III. Decrease in oxygen availability to Arctic foxes
Question 5
HLPaper 2
Sockeye salmon (Oncorhynchus nerka) spend the first years of their lives in the freshwater lakes of Alaska before migrating to marine waters. Their first months in marine waters are spent foraging and growing near the shore line. They then move to offshore regions of the North Pacific Ocean for 2 to 3 years. 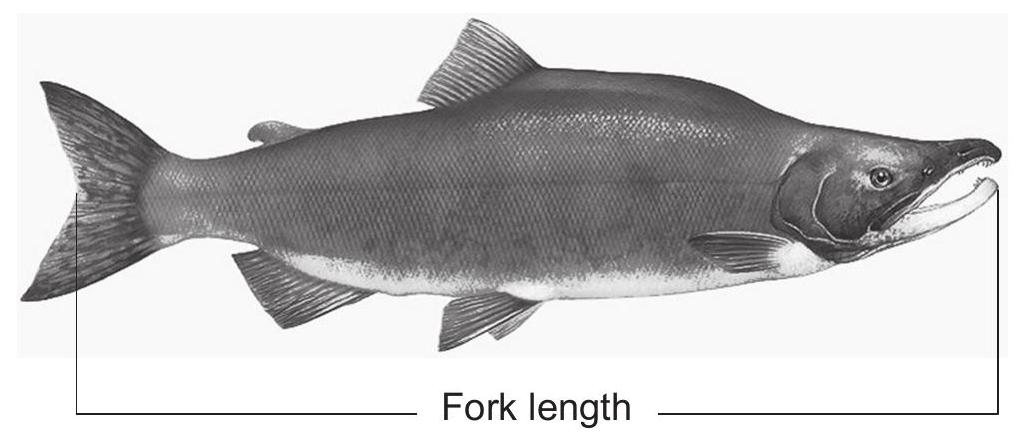 [Source: "Oncorhynchus nerka" by Timothy Knepp of the Fish and Wildlife Service. US Fish and Wildlife Service. Licensed under Public Domain via Commons https://wccyusoueahdpdicsyrg.supabase.co/storage/v1/object/public/question-images/images/b9c32b2e-53b8-4722-a4a4-2c906ad6d8f4.jpg] The graph shows fork length frequency of juvenile O. nerka caught during their first months in marine waters in autumn 2008 and ocean age one O. nerka caught 15 months later during winter 2009 in the North Pacific Ocean.
 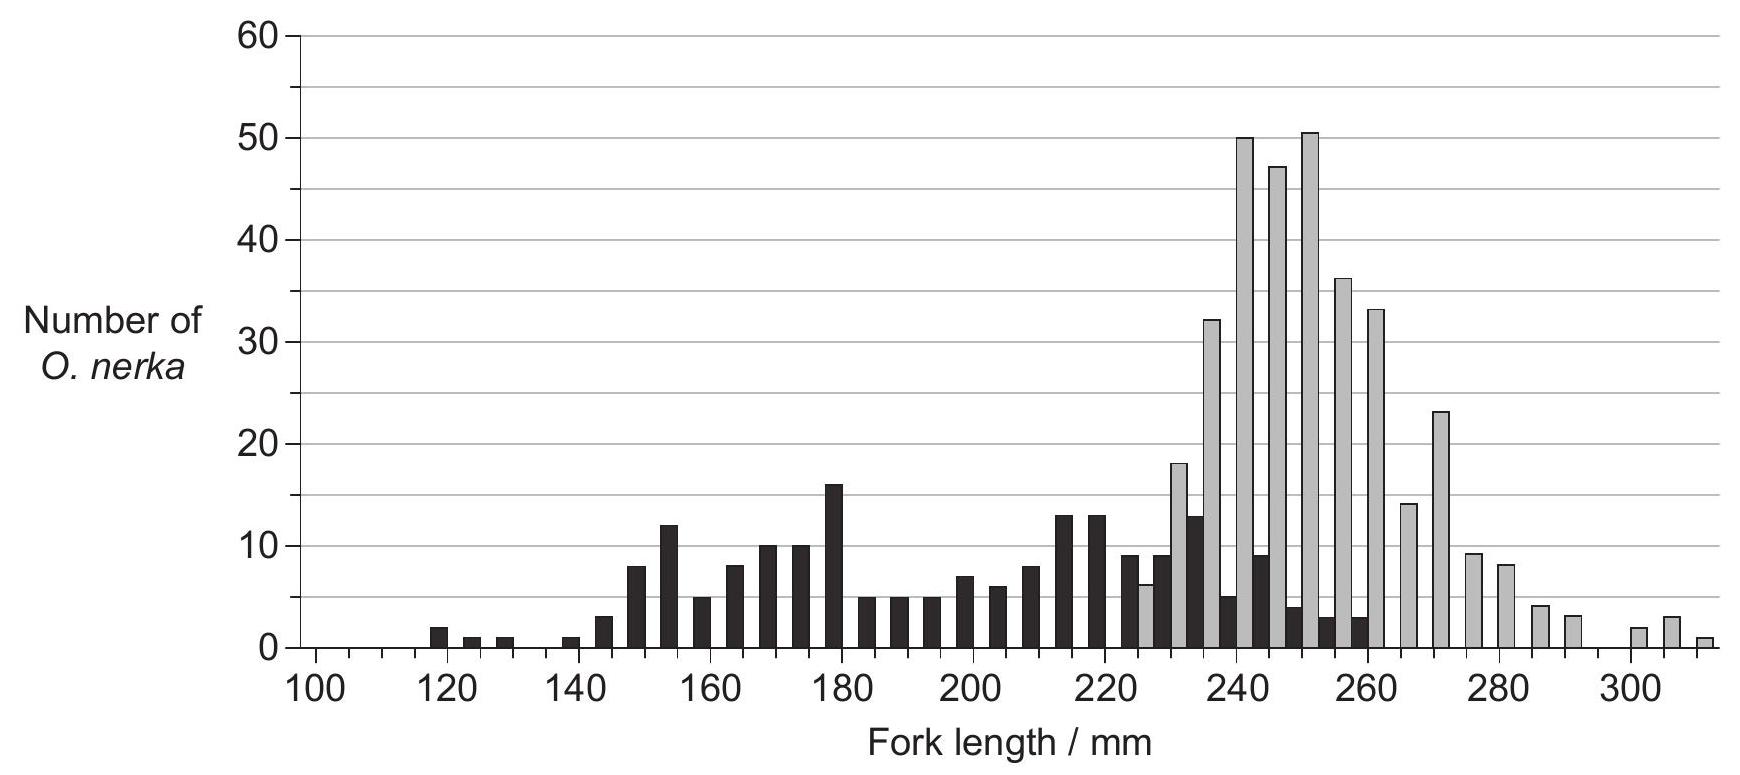 Key: □ autumn 2008 (juvenile O. nerka) □ winter 2009 (ocean age one O. nerka) [Source: Adapted from Edward V. Farley, Alexander Starovoytov, Svetlana Naydenko, Ron Heintz, Marc Trudel, Charles Guthrie, Lisa Eisner and Jeffrey R. Guyon (2011) 'Implications of a warming eastern Bering Sea for Bristol Bay sockeye salmon'. ICES Journal of Marine Science, 68 (6), pages 1138-1146, by permission of Oxford University Press.]
1.[1]
Identify the total number of O. nerka with fork length from 240 to 245 mm caught in autumn 2008 and winter 2009.
2.[2]
Compare the data in the graph for autumn 2008 and winter 2009.
3.[2]
Suggest two factors that could affect the distribution of O. nerka in the North Pacific Ocean.
4.[1]
State the range of lipid content measured in O. nerka caught during autumn 2008.
5.[2]
Outline any correlation between total lipid content and fork length in autumn 2008 and in winter 2009.
6.[2]
Suggest reasons for the differences in lipid content.
7.[1]
Describe the relationship between the distance of upstream migration and the concentration of PCBs in O. nerka.
8.[1]
State the concentration of PCBs in muscle lipids at 125 km from the ocean estimated by the correlation line.
9.[1]
As the O. nerka migrate upstream they no longer feed. Suggest a reason for the relationship of distance of upstream migration and concentration of PCBs in muscle lipids.
Question 6
SLPaper 1A
In a population of rabbits studied over a period of six months, it was found that natality was greater than mortality and emigration was greater than immigration. What can be concluded about the final population of rabbits?
Question 7
SLPaper 1A
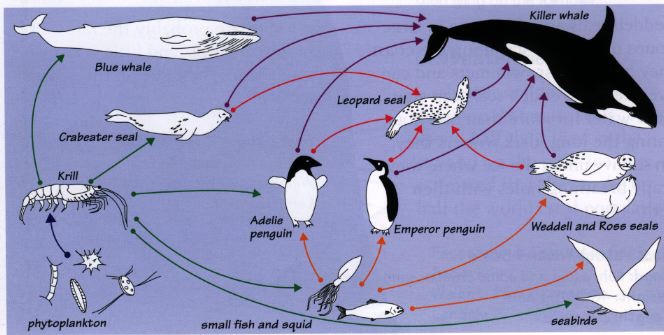
What is the trophic level of the Leopard seal?
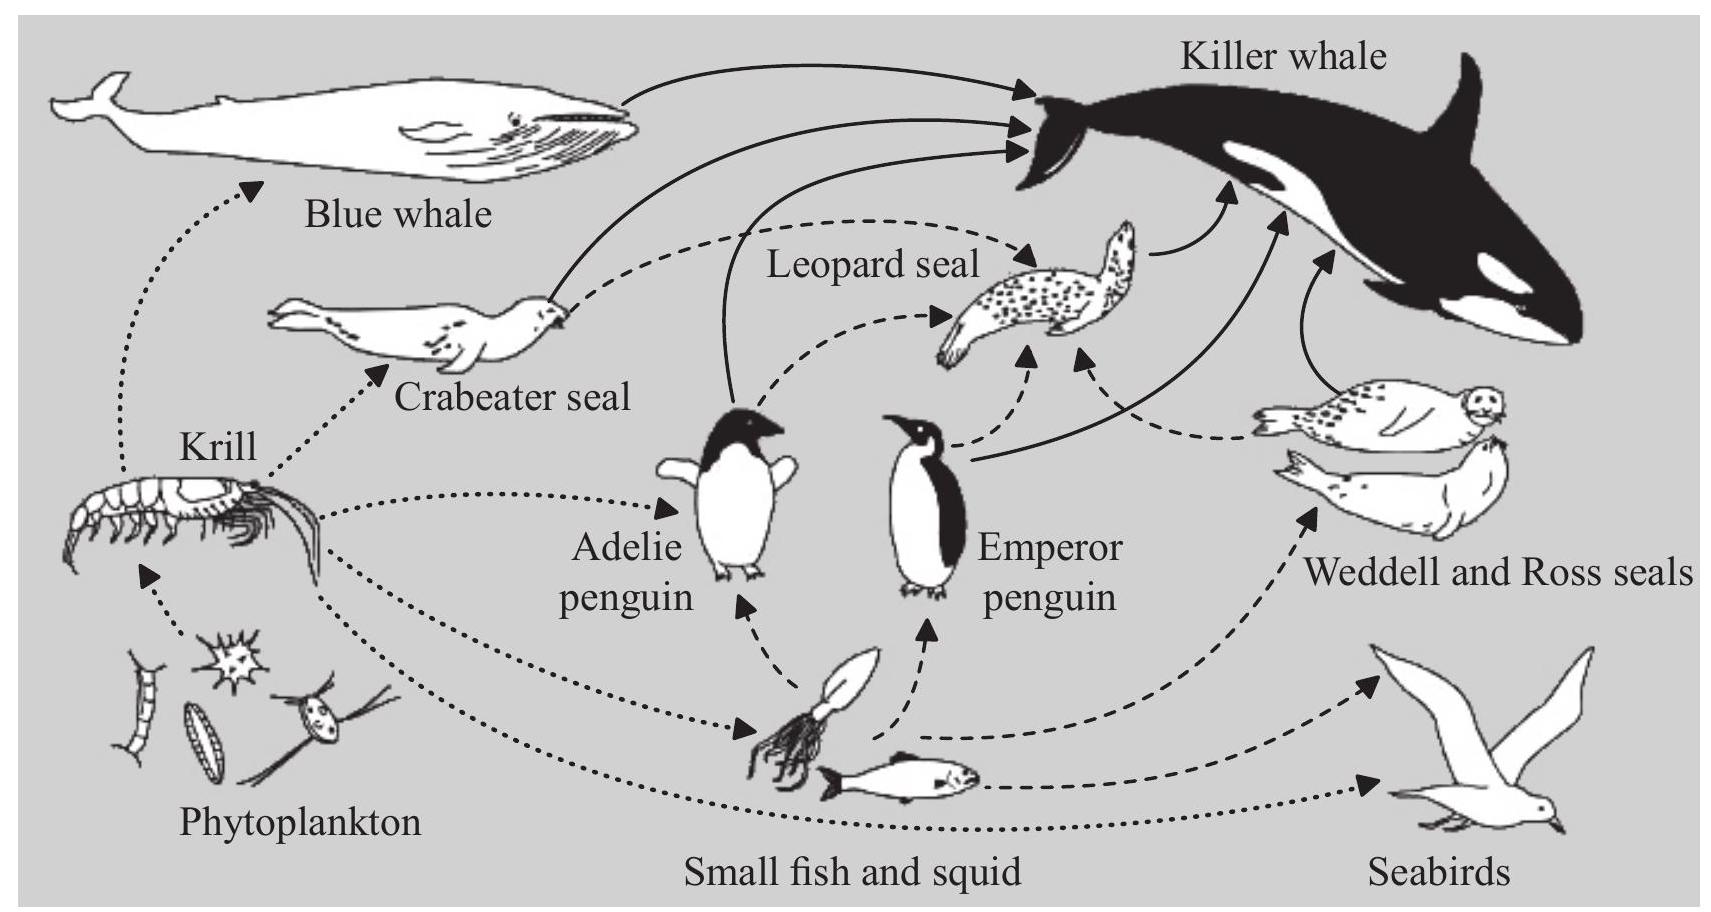
[Source: adapted from http://amurdoch.tripod.com/yr4/AntFoodWeb.JPG]
I. Secondary consumer II. Tertiary consumer III. Quaternary consumer
Question 8
SLPaper 2
1.
[2]
Compare and contrast the mode of nutrition of detritivores and saprotrophs.
| Detritivores | Saprotrophs | |
|---|---|---|
| Similarity | ||
| Difference |
2.[1]
Draw a food chain from this food web, showing at least three organisms.
3.[2]
Explain the reasons for food chains rarely containing more than four or five trophic levels.
4.[2]
The amount of food passing into food chains can be affected by the rate of photosynthesis. Explain the effect of one limiting factor on photosynthesis.
5.[1]
All of the leaves in the image are from Solanum, a wild genus of tomato.
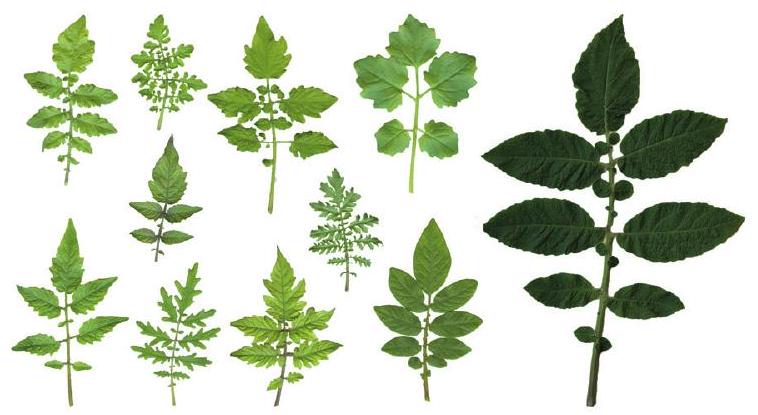
State one cause of variation in a plant such as the tomato.
Question 9
SLPaper 1A
A researcher captures 100 sparrows (a small bird), tags them and then releases them. One week later, the researcher recaptures 50 sparrows, 20 of which have tags on them. What is the size of the sparrow population?
Question 10
SLPaper 2
Phenologists are biologists who study the timing of seasonal activities in animals and plants, such as the opening of tree leaves and the laying of eggs by birds. Data such as these can provide evidence of climate changes, including global warming. The date in the spring when new leaves open on horse chestnut trees (Aesculus hippocastaneum) has been recorded in Germany every year since 1951. The graph below shows the difference between each year's date of leaf opening and the mean date of leaf opening between 1970 and 2000. Negative values indicate that the date of leaf opening was earlier than the mean. The graph also shows the difference between each year's mean temperature during March and April and the overall mean temperature for these two months. The data for temperature was obtained from the records of thirty-five German climate stations. 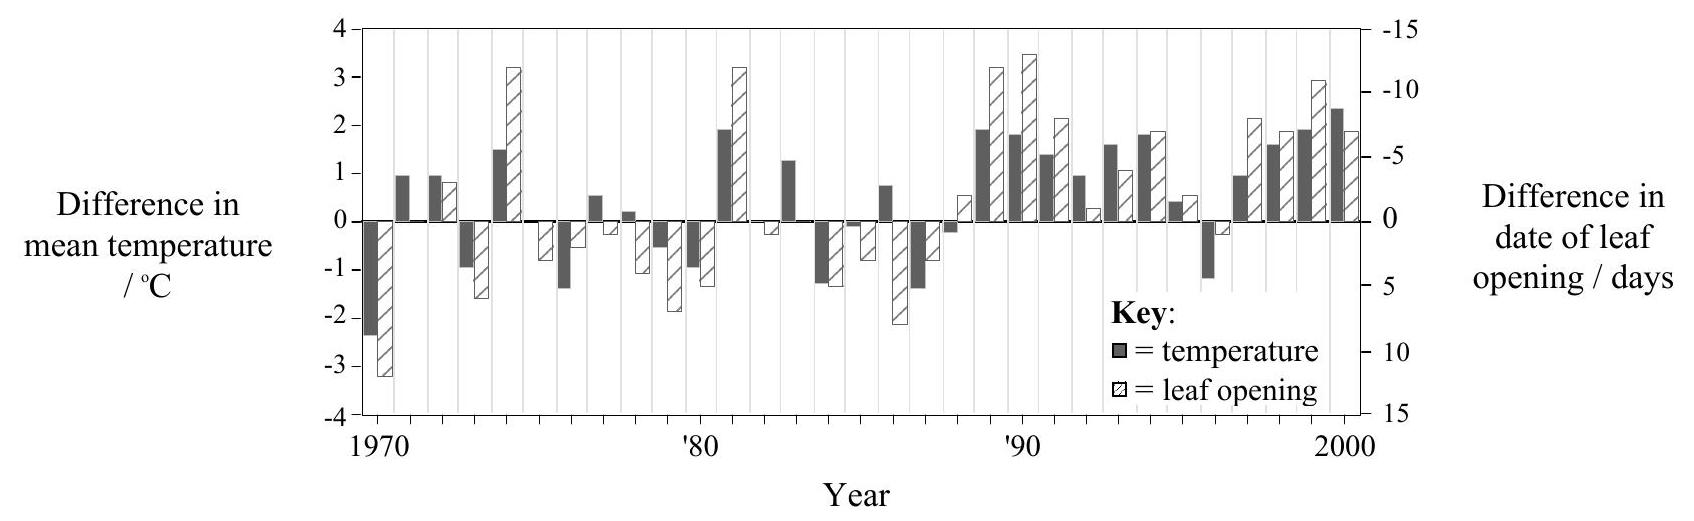 [Source: Walther et al., Nature (2002), 416, pages 389-395] From 1973 onwards phenologists in the Netherlands have been studying a population of great tits (Parus major) in a forest on the Hoge Veluwe. Nest boxes are checked every week to find out when the great tits lay their eggs and how many eggs they lay. Young birds are ringed when they are seven days old, to allow the reproductive success of their parents to be monitored. Great tits feed on arthropods, especially caterpillars. The phenologists found that the date of maximum caterpillar biomass each year in the forest could be estimated accurately using temperature records. The graphs below show the mean date of egg laying and the estimated date of maximum caterpillar biomass for each year from 1973 to 1995.
 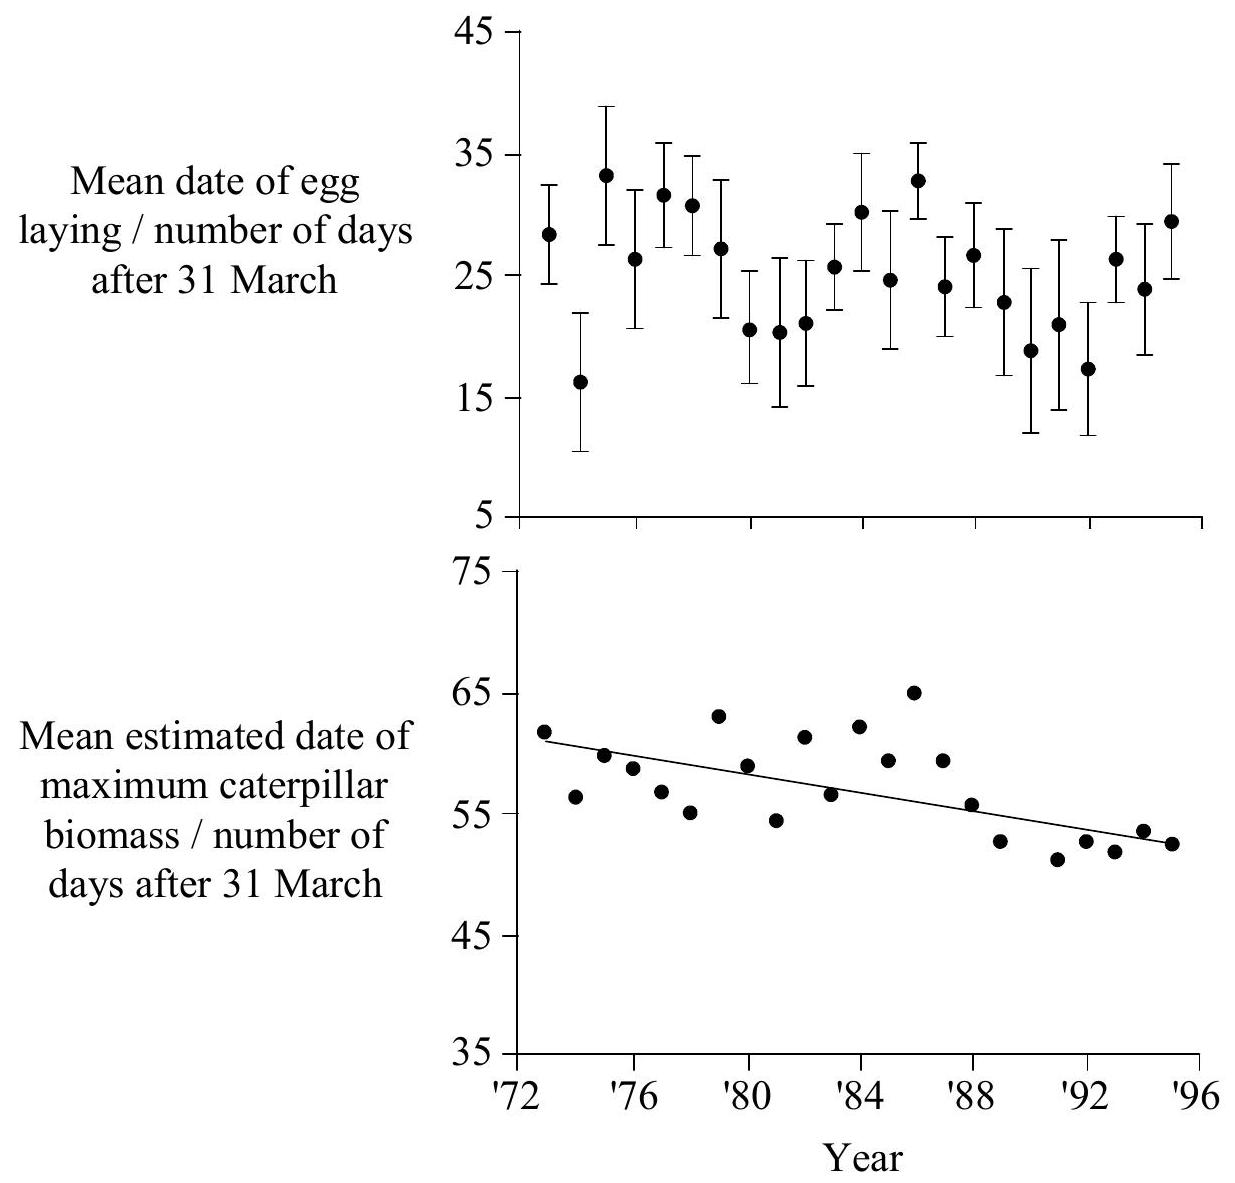 [Source: Visser, Noordwijk, Tinbergen and Lessells, Proceedings of the Royal Society of London, (1998), 265, pages 1867-1870] There was no statistically significant change in the date of egg laying between 1973 and 1995, but the phenologists found evidence that natural selection will eventually cause a change in the date of egg laying.
1.[1]
Identify the year in which there was the earliest opening of horse chestnut leaves.
2.[1]
Identify the year in which there was the lowest mean temperature in March and April.
3.[1]
Use the data in the graph to deduce the relationship between temperatures in March and April and the date of opening of leaves on horse chestnut trees.
4.[2]
Use the data in the graph to deduce whether there is evidence of global warming towards the end of the twentieth century.
5.[1]
Compare the date of egg laying with the date of maximum caterpillar biomass.
6.[1]
Suggest an advantage to great tits of the difference in dates.
7.[1]
State the trend, shown in the graph, for the date of maximum caterpillar biomass.
8.[2]
Explain how natural selection could cause a change in the date of egg laying in the population of great tits in the forest on the Hoge Veluwe.