Note
If the work does not reach a standard outlined by the performance level descriptors, 0 marks are awarded for this criterion.

If the work does not reach a standard outlined by the performance level descriptors, 0 marks are awarded for this criterion.
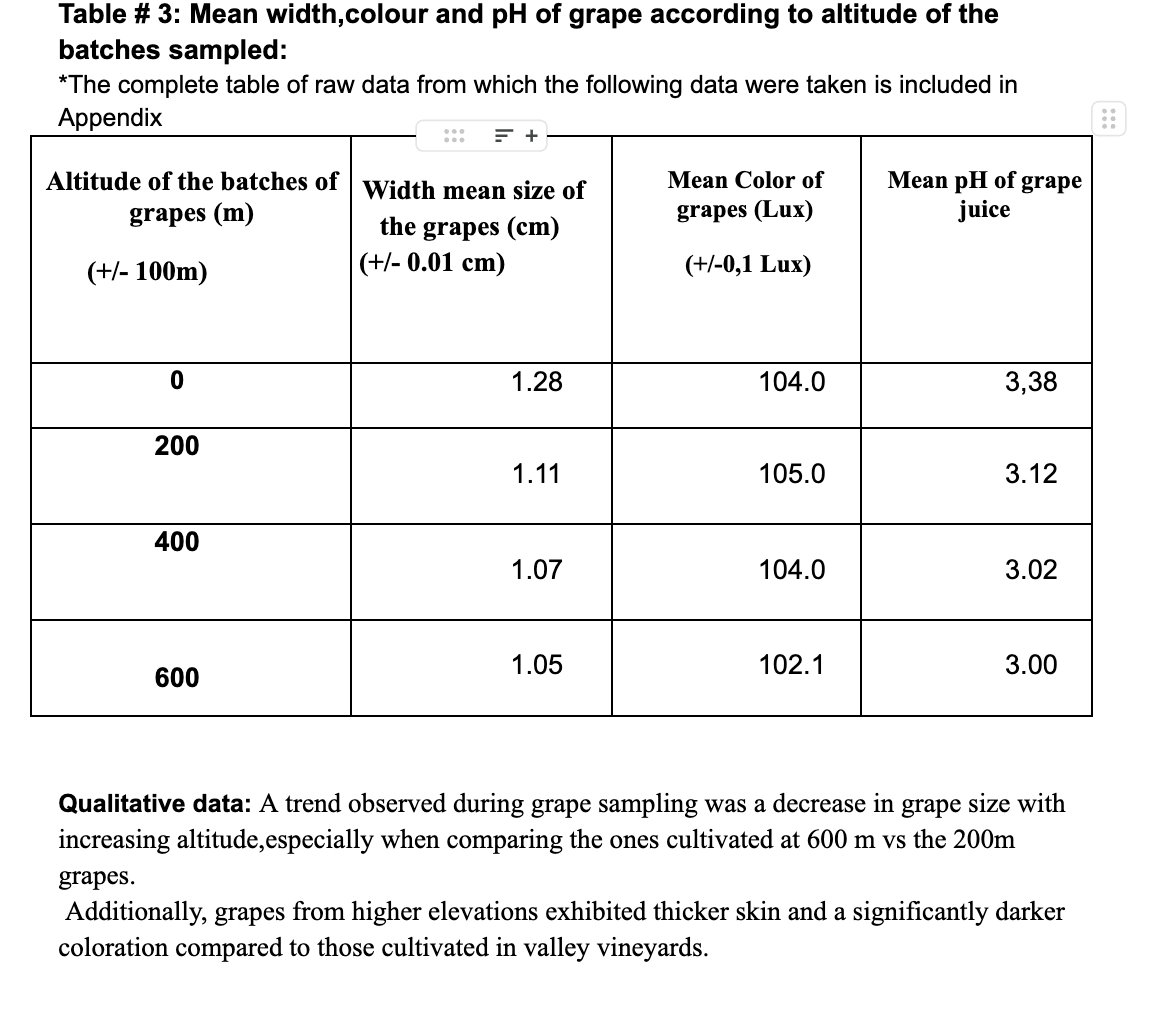
If large amounts of raw data are collected, it is recommended that students only present a sample of the data in the body of the essay and include the whole table of raw data in the appendix.
SI units should be used throughout the report.
Research question:
“ How does altitude (100m to 600 m) affect the pH level, colour and width size of Nebbiolo wine grapes cultivated in Argentina’s Mendoza region?”
The use of spreadsheets might be appropriate here as they allow for the easier processing of data.
Pay particular attention to the use of significant figures and decimal places in the calculations.

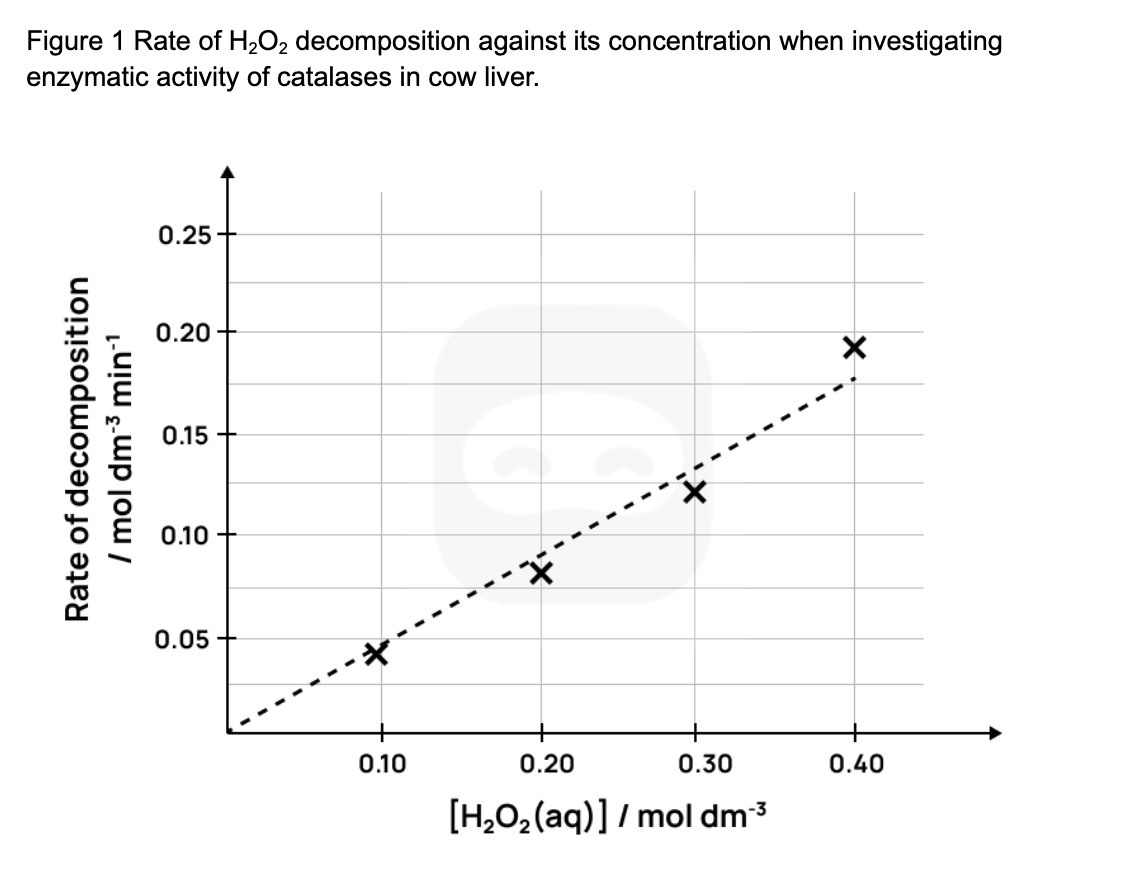
An instance of a graph is shown below for an investigation to determine how concentration of substrate affects the rate of reaction of a specific enzyme:
Research question:
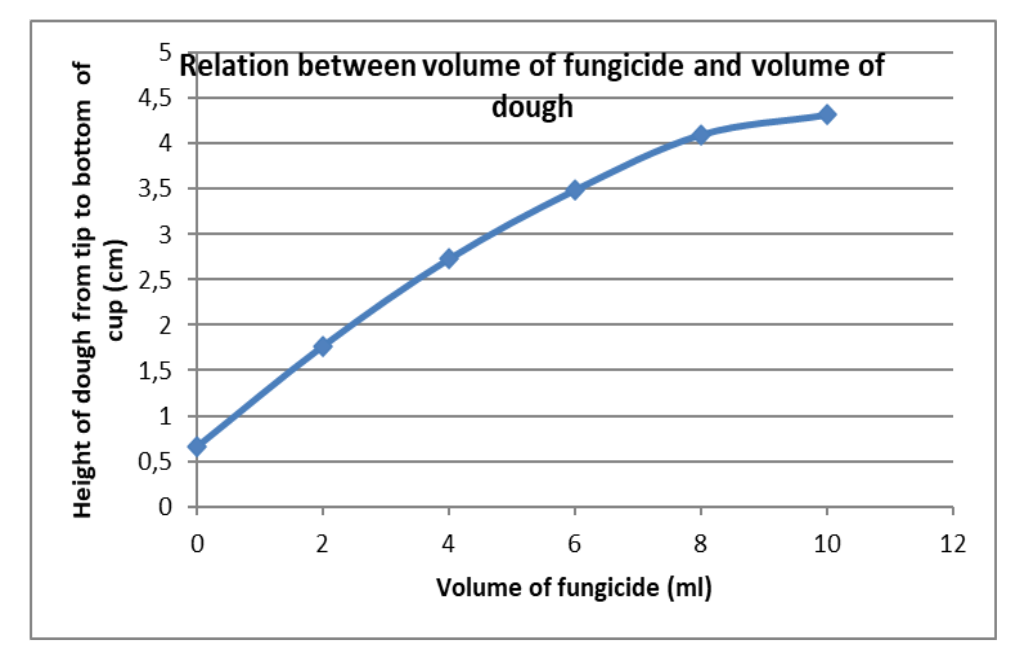
''How is the height of dough used to make bread with yeasts affected by the addition of different volumes of homemade fungicide made out of onion?''
Research question
“How do different volumes of acetic acid affect the pH of the solutions where Phaseolus vulgaris Haricot beans are placed, producing a change of weight in the beans due to osmosis?”
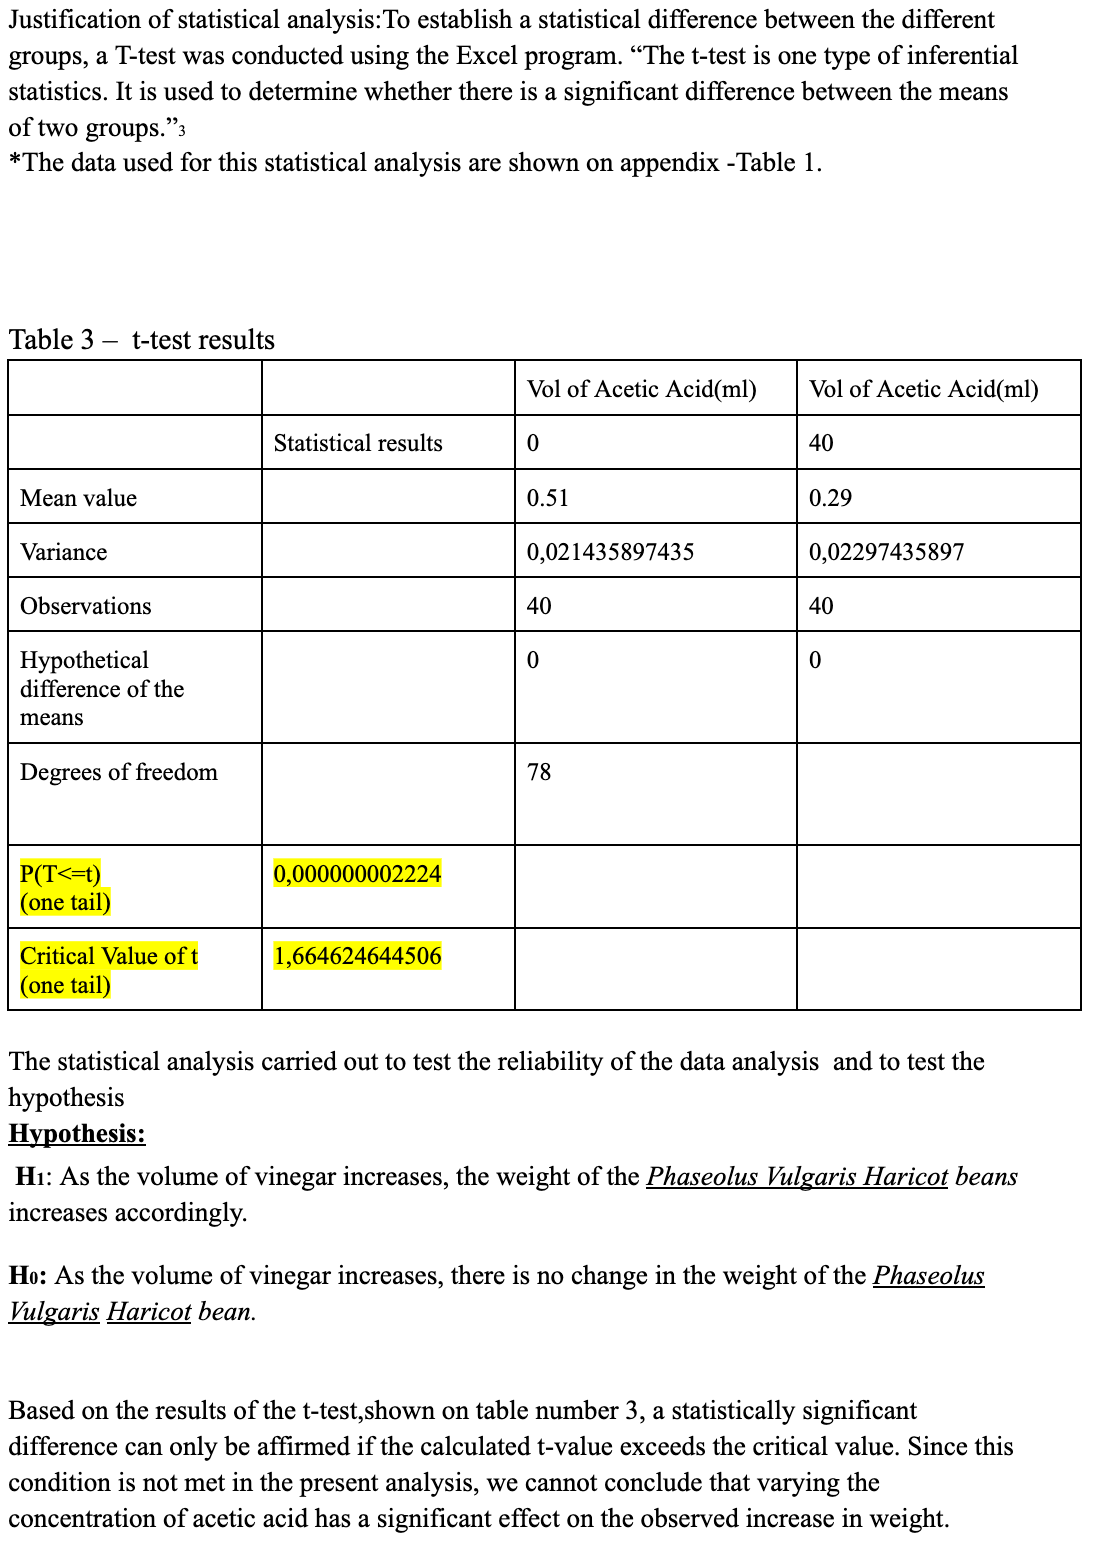
Example 3 shows a correct application of a statistical analysis, using a sufficient set of data and with sufficient justified scientific support.
For instance, a mass recorded on a mass balance that can measure to four decimal places is more precise than one that can measure to two decimal places and therefore has a lower absolute uncertainty, as can be seen below.
$$2.50 \pm 0.01 \text{ g}$$
$$2.5000 \pm 0.0001 \text{ g}$$
Some instances of systematic errors are:

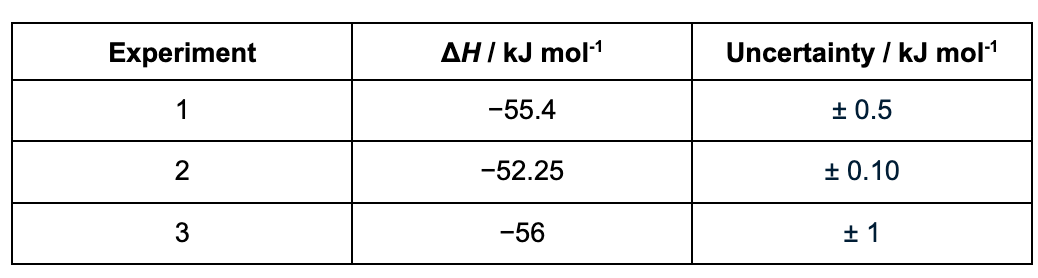
It is recommended that students conduct repeat trials in their investigation which will require repeat measurements of the dependent variable.
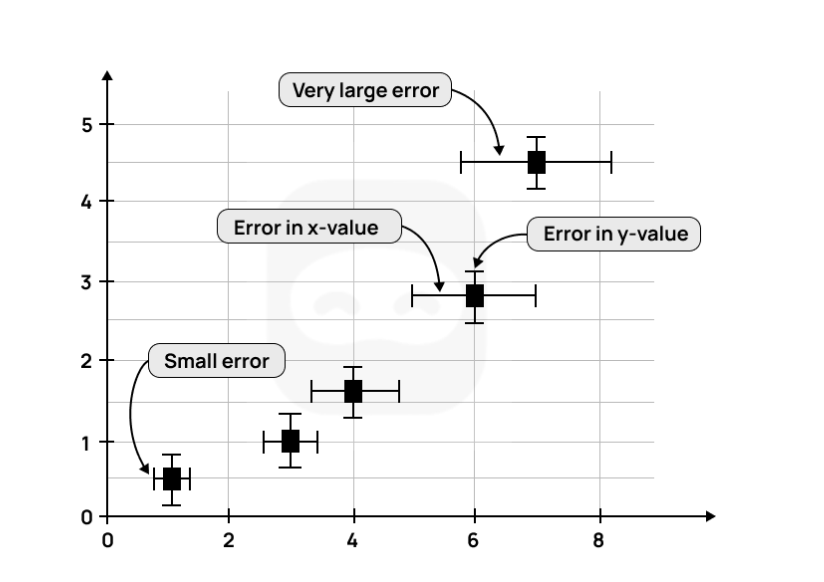
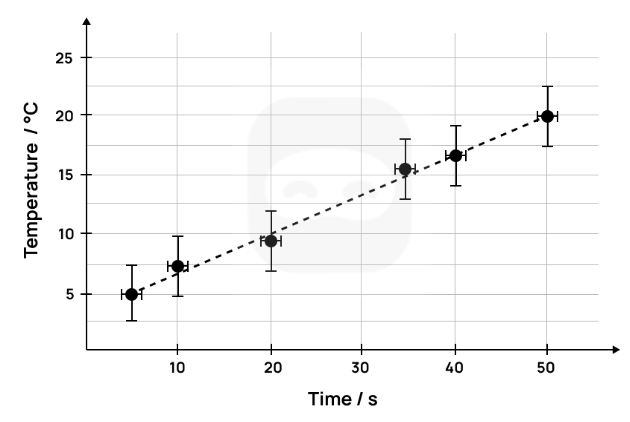
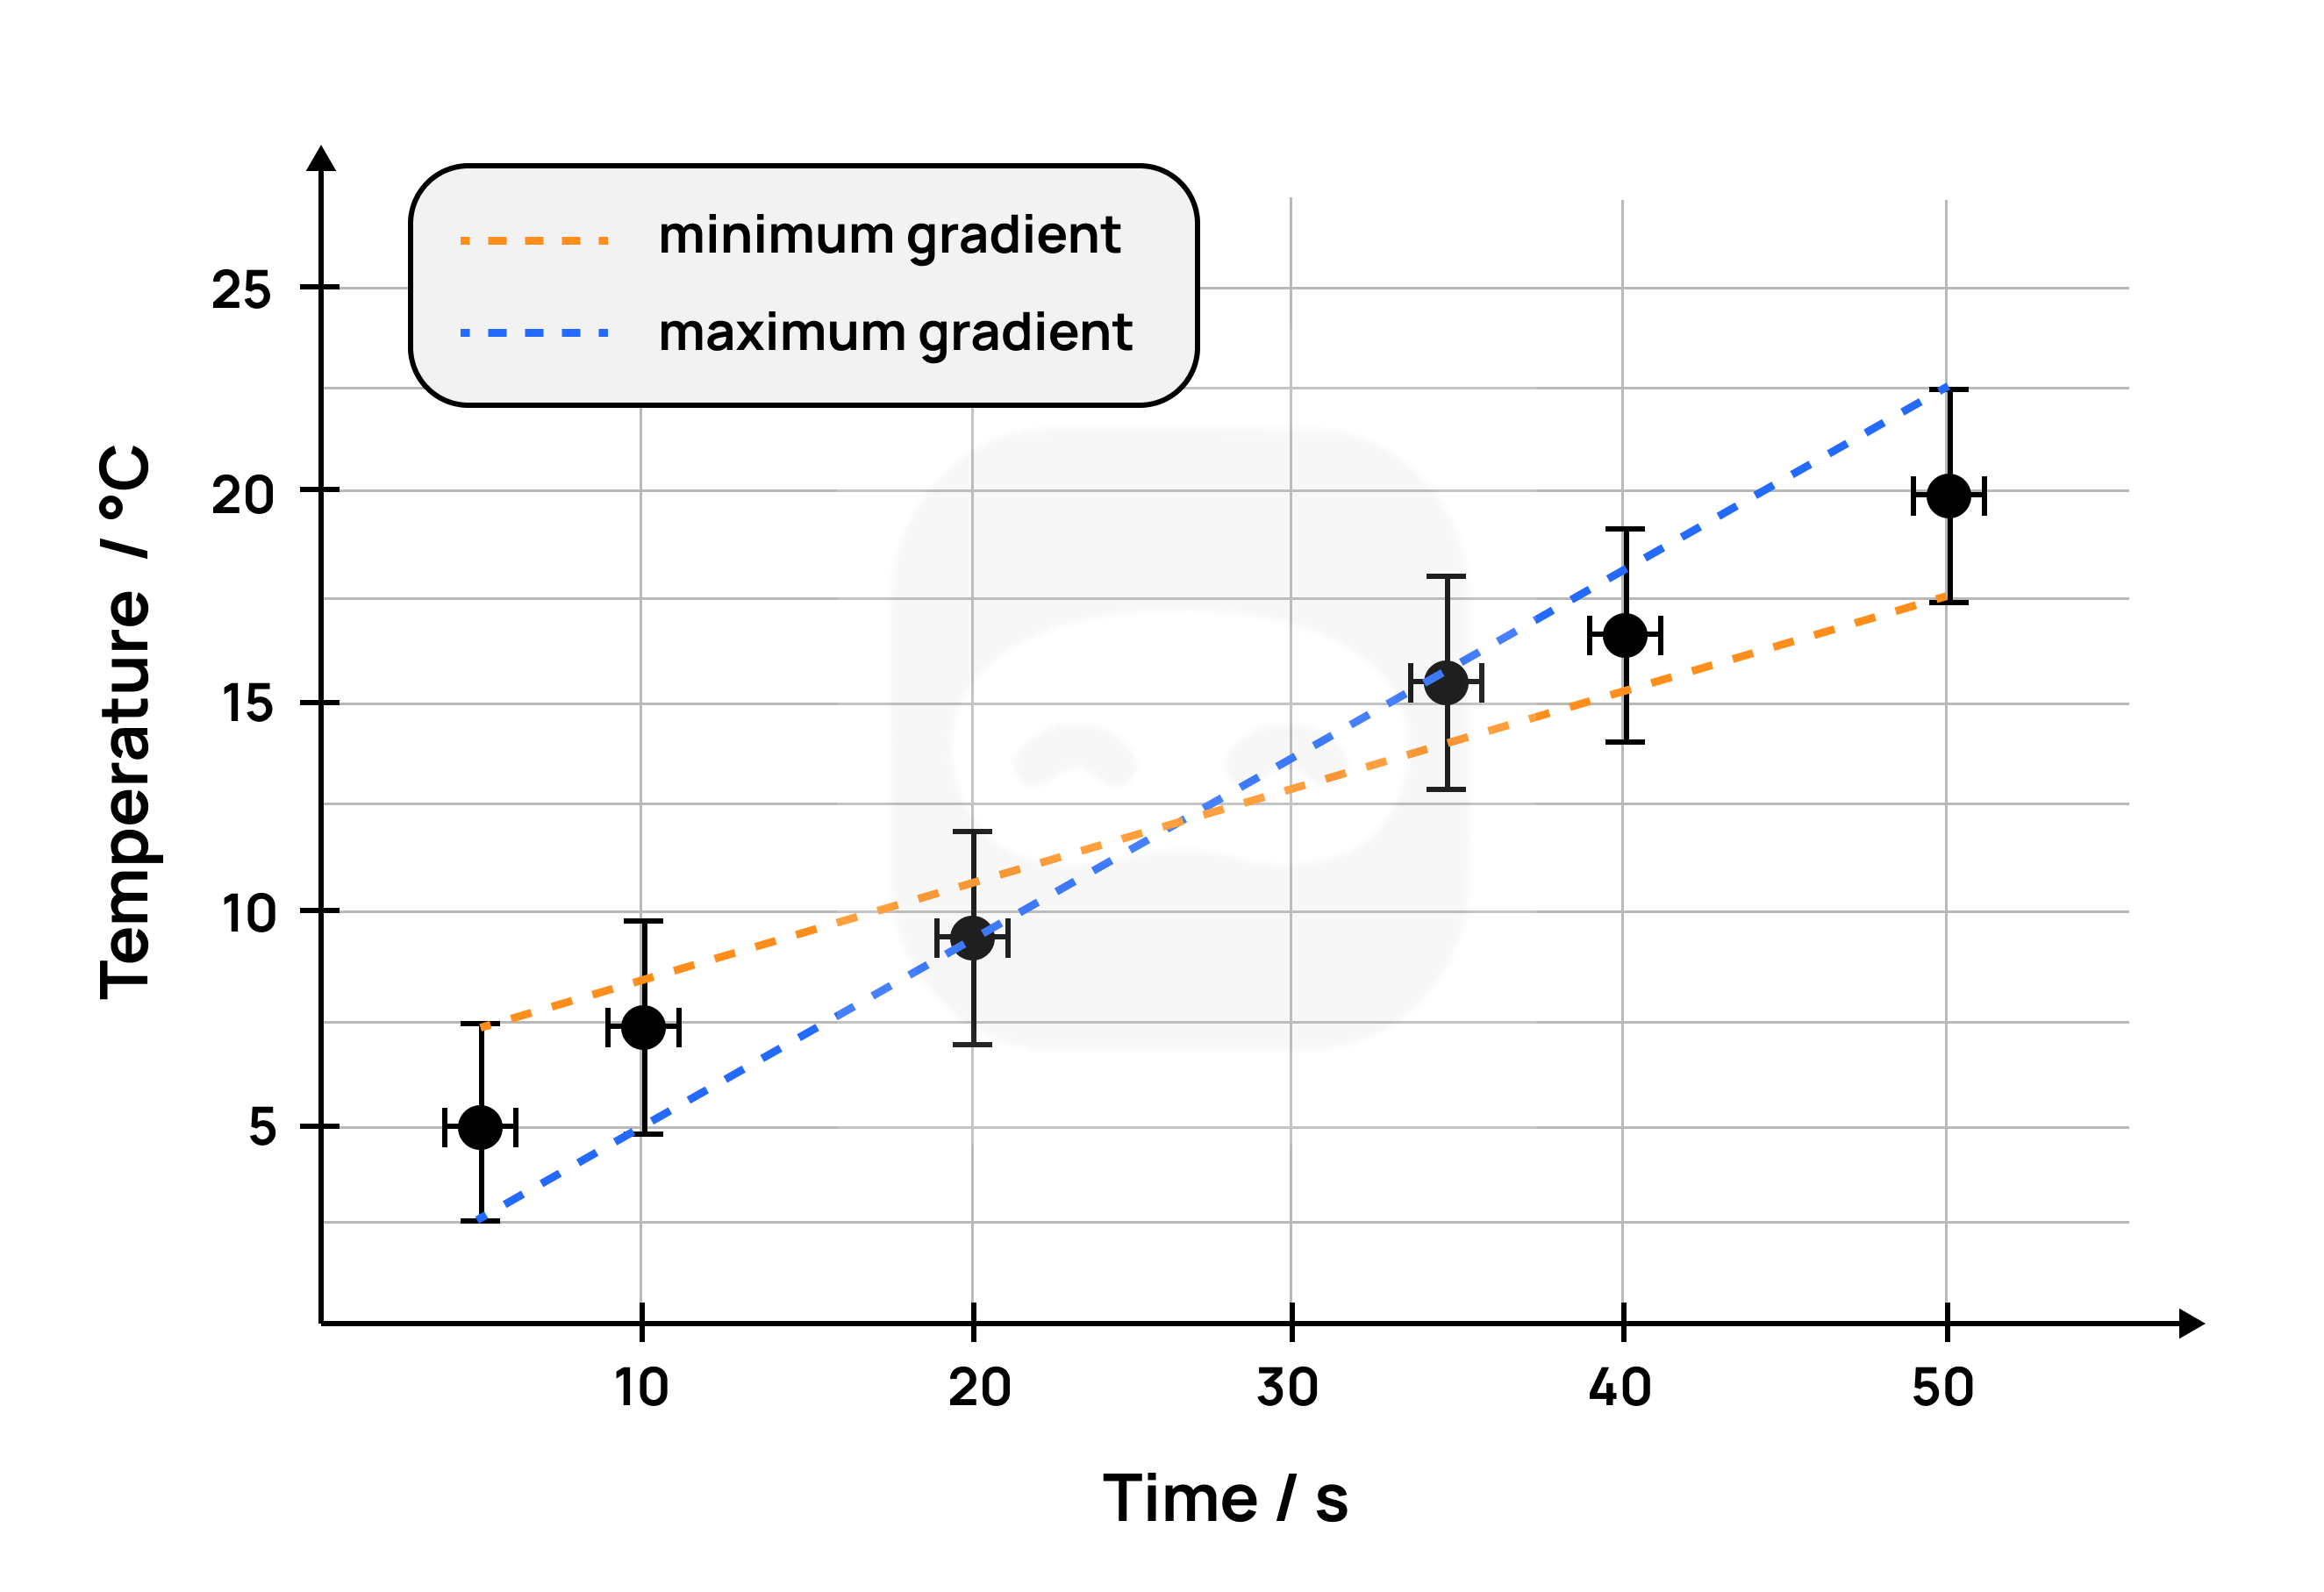
The gradient of the best-fit line is the average of the minimum gradient and the maximum gradient. $$m = \frac{m_{\text{maximum gradient}} + m_{\text{minimum gradient}}}{2}$$
The uncertainty of the final gradient is calculated as follows: $$\Delta m = \frac{m_{\text{maximum gradient}} - m_{\text{minimum gradient}}}{2}$$
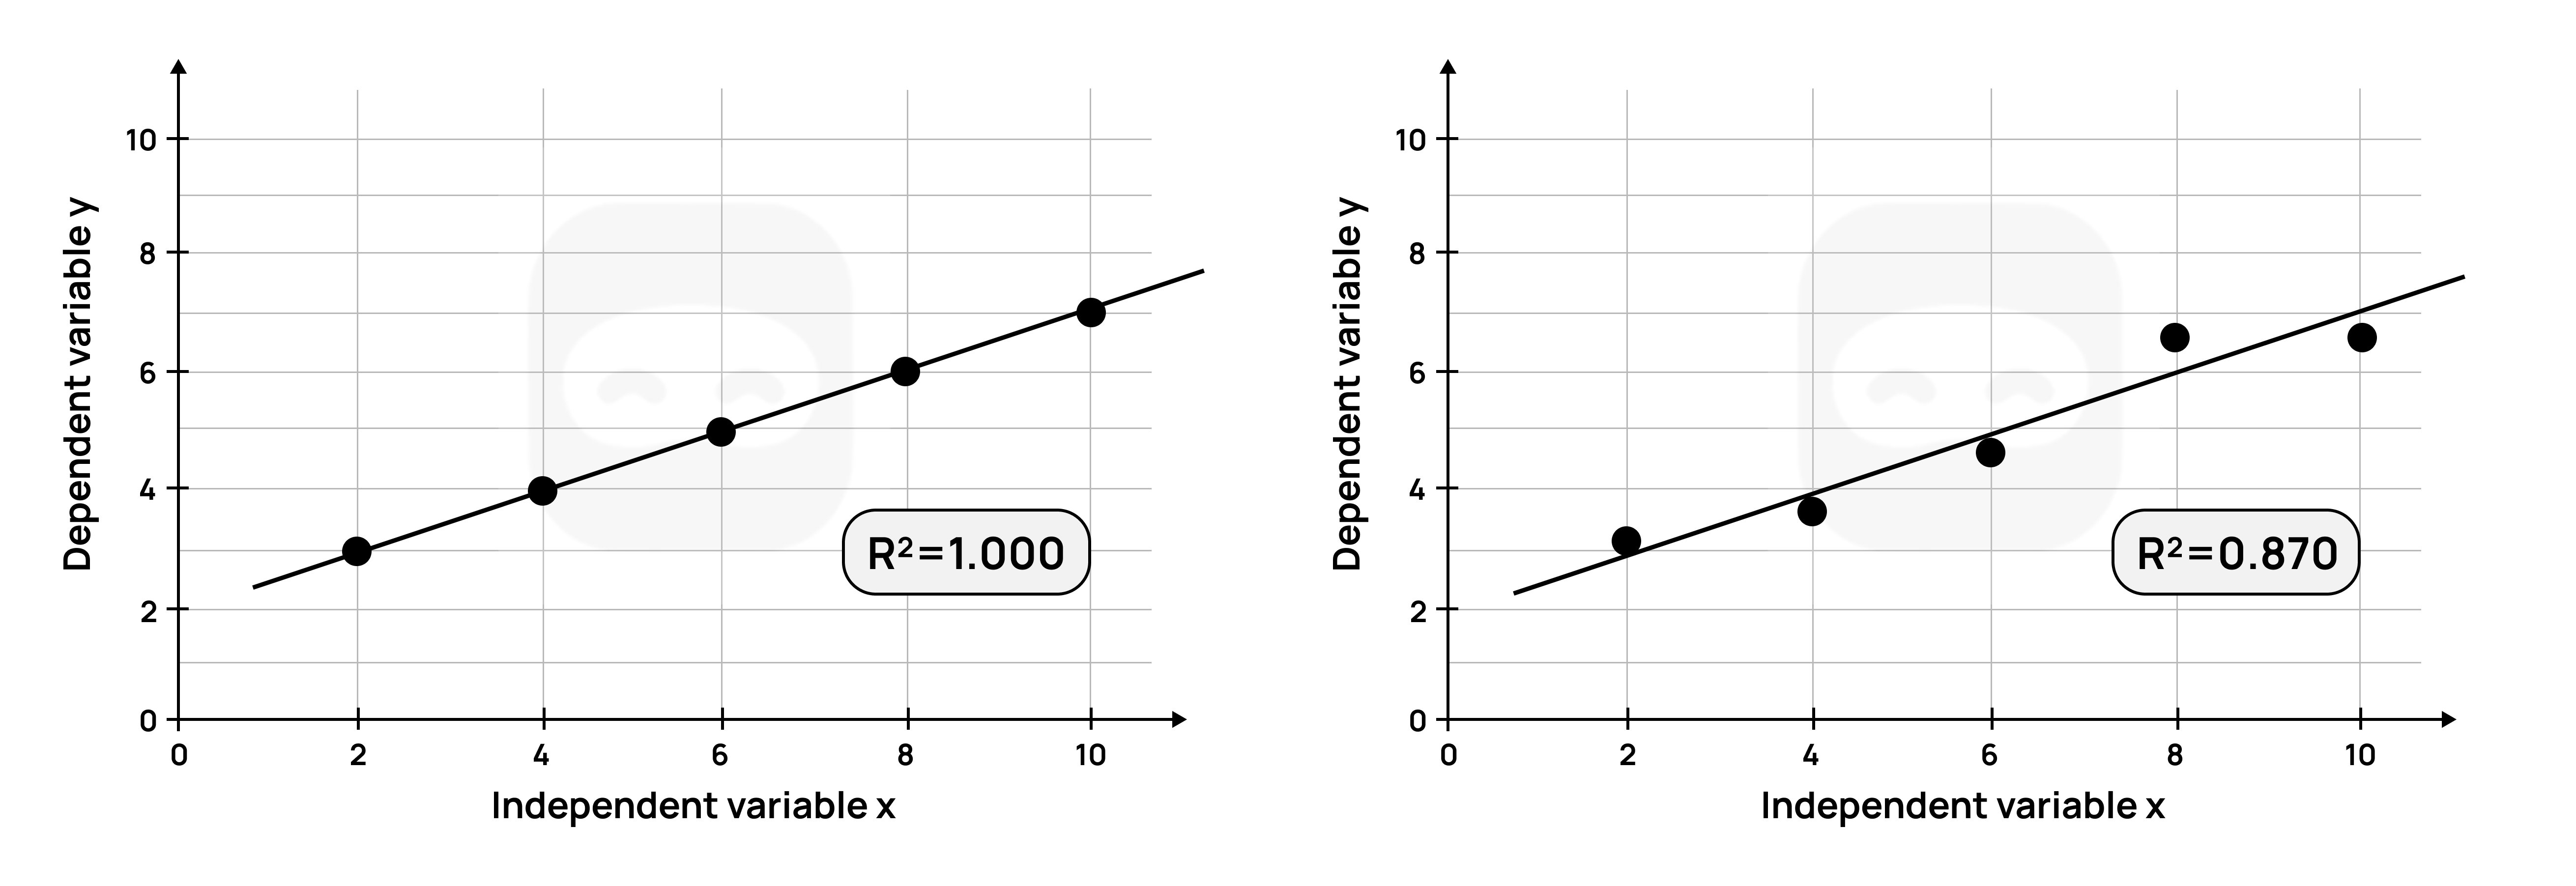
Consider the two graphs shown and their R² values.
In this case, the modification(s) made should be described in the report.