Practice 4.3 Carbon cycling with authentic IB Biology exam questions for both SL and HL students. This question bank mirrors Paper 1A, 1B, 2 structure, covering key topics like cell biology, genetics, and ecology. Get instant solutions, detailed explanations, and build exam confidence with questions in the style of IB examiners.
Paper
Level
Question 1
HLPaper 1A
How do greenhouse gases contribute to global warming?
Question 2
SLPaper 1A
Which conditions favor the formation of peat?
| A. | Dry | Aerobic | Acidic |
| B. | Wet | Anaerobic | Acidic |
| C. | Dry | Anaerobic | Basic |
| D. | Wet | Aerobic | Acidic |
Question 3
SLPaper 1A
The diagram shows a simplified carbon cycle.
Which processes are taking place at X and Y?
| X | Y | |
|---|---|---|
| A. | photosynthesis | fossilization |
| B. | respiration | fossilization |
| C. | photosynthesis | combustion |
| D. | respiration | combustion |
Question 4
HLPaper 1A
The table shows the monthly CO2 concentrations in mgL-1 taken at two monitoring stations.
| Month | Jul 2011 | Aug 2011 | Sept 2011 | Oct 2011 | Nov 2011 | Dec 2011 | Jan 2012 | Feb 2012 | Mar 2012 | Apr 2012 | May 2012 | Jun 2012 |
|---|---|---|---|---|---|---|---|---|---|---|---|---|
| Cape Grim, Australia | 388 | 389 | 389 | 389 | 389 | 389 | 389 | 389 | 389 | 389 | 389 | 390 |
| Mauna Loa, Hawaii, USA | 392 | 390 | 389 | 389 | 390 | 392 | 393 | 394 | 394 | 396 | 397 | 396 |
What is directly indicated by the data?
Question 5
SLPaper 2
1.[6]
Draw and label a diagram of the carbon cycle.
2.[4]
Outline the effect of carbon dioxide concentration on the rate of photosynthesis and how this can be measured by carbon dioxide uptake.
3.[5]
Explain how carbon dioxide is produced in anaerobic and in aerobic respiration.
Question 6
SLPaper 1A
The diagram shows a simplified carbon cycle.

Which processes are taking place at X and Y ?
| X | Y | |
|---|---|---|
| A. | photosynthesis | fossilization |
| B. | respiration | fossilization |
| C. | photosynthesis | combustion |
| D. | respiration | combustion |
Question 7
SLPaper 1A
Carbon sinks are any reservoirs that absorb and store carbon dioxide from the atmosphere. Which process increases the size of the carbon sink in oceans?
Question 8
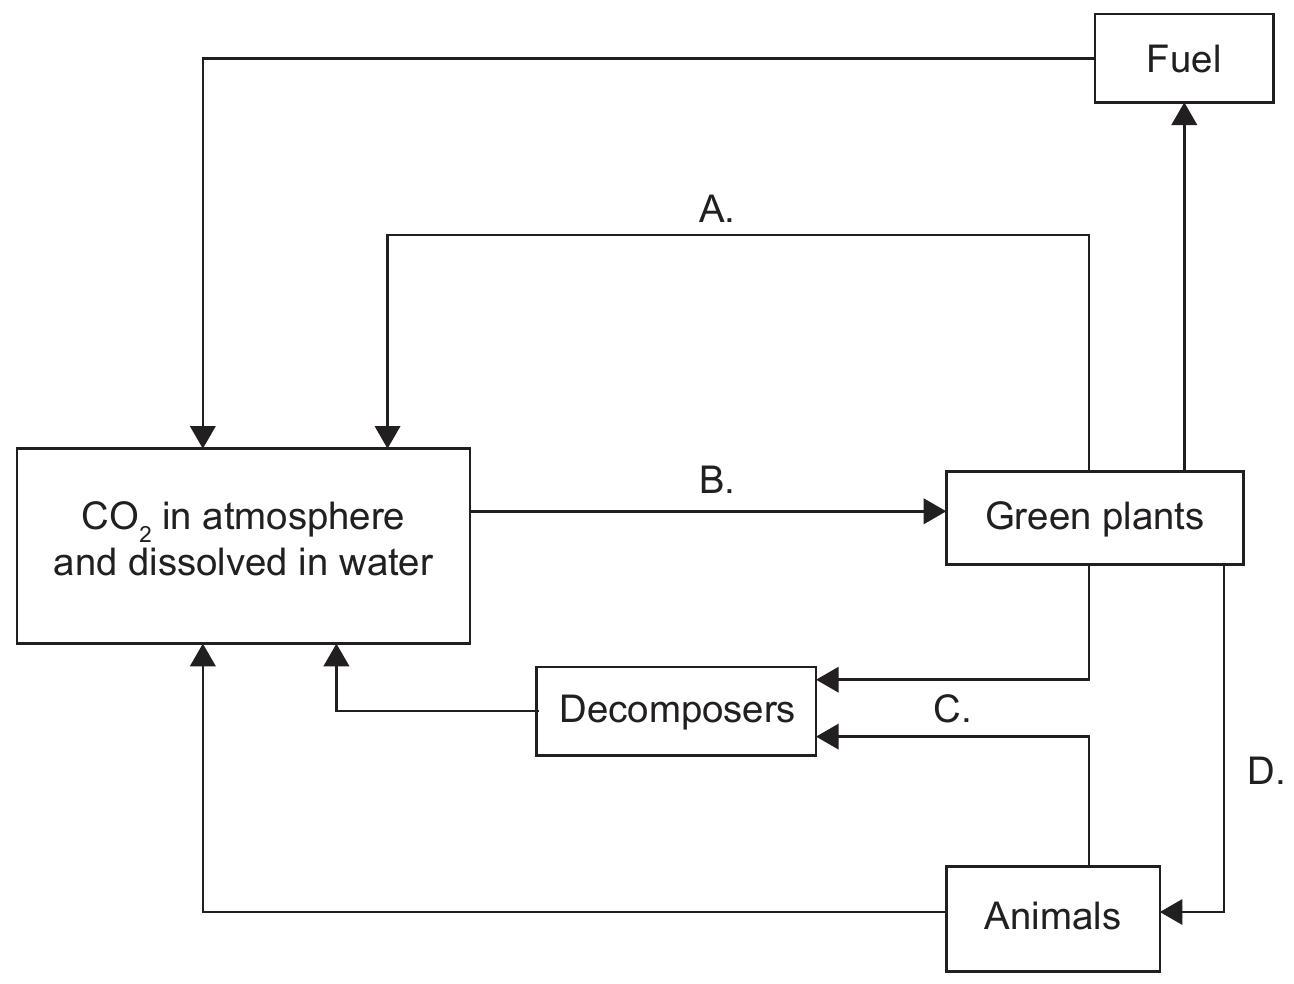
HLPaper 1A
In the diagram, which of the processes labelled A to D transfers the largest mass of carbon per year in a woodland ecosystem?
Question 9
SLPaper 2
1.[5]
All organisms take in and also release carbon compounds. Draw a labelled diagram of the carbon cycle.
2.[6]
Describe how the rate of photosynthesis can be measured.
3.[7]
Explain the mechanism of ventilation in humans.
Question 10
SLPaper 1A
The table shows the monthly concentrations in taken at two monitoring stations.
| Month | Jul 2011 | Aug 2011 | Sept 2011 | Oct 2011 | Nov 2011 | Dec 2011 | Jan 2012 | Feb 2012 | Mar 2012 | Apr 2012 | May 2012 | Jun 2012 |
|---|---|---|---|---|---|---|---|---|---|---|---|---|
| Cape Grim, Australia | 388 | 389 | 389 | 389 | 389 | 389 | 389 | 389 | 389 | 389 | 389 | 390 |
| Mauna Loa, Hawaii, USA | 392 | 390 | 389 | 389 | 390 | 392 | 393 | 394 | 394 | 396 | 397 | 396 |
What is directly indicated by the data?