



Large datasets have a particular talent: they make you feel productive while quietly multiplying your problems.
One minute, your IA is a neat idea and a simple table. The next, you are staring at 1,200 rows, five versions of the same spreadsheet, and a graph that looks like a seismograph during an earthquake. And the worst part is that none of this guarantees a better grade. In an IB IA, quantity only helps when it becomes clarity.
This guide is about turning “a lot of data” into evidence an examiner can trust. You will learn how to collect, organize, clean, analyze, and present large datasets in your IA without losing your mind (or your marks).
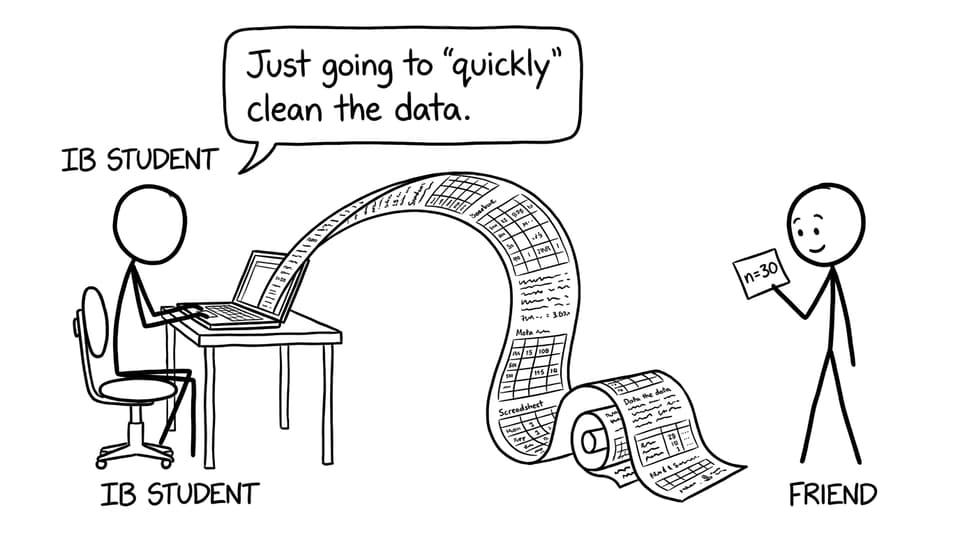
IA large dataset checklist (use this before you analyze)
If you only take one thing from this post, take this: your IA dataset should be auditable. Someone should be able to follow your steps and understand how raw values became conclusions.
Use this quick checklist:
-
Your research question is specific enough to define what data you actually need.
-
You have a clear data dictionary (variable names, units, definitions).
-
Raw data, processed data, and final summary outputs are separated.
-
You have a cleaning log (what you removed/changed and why).
-
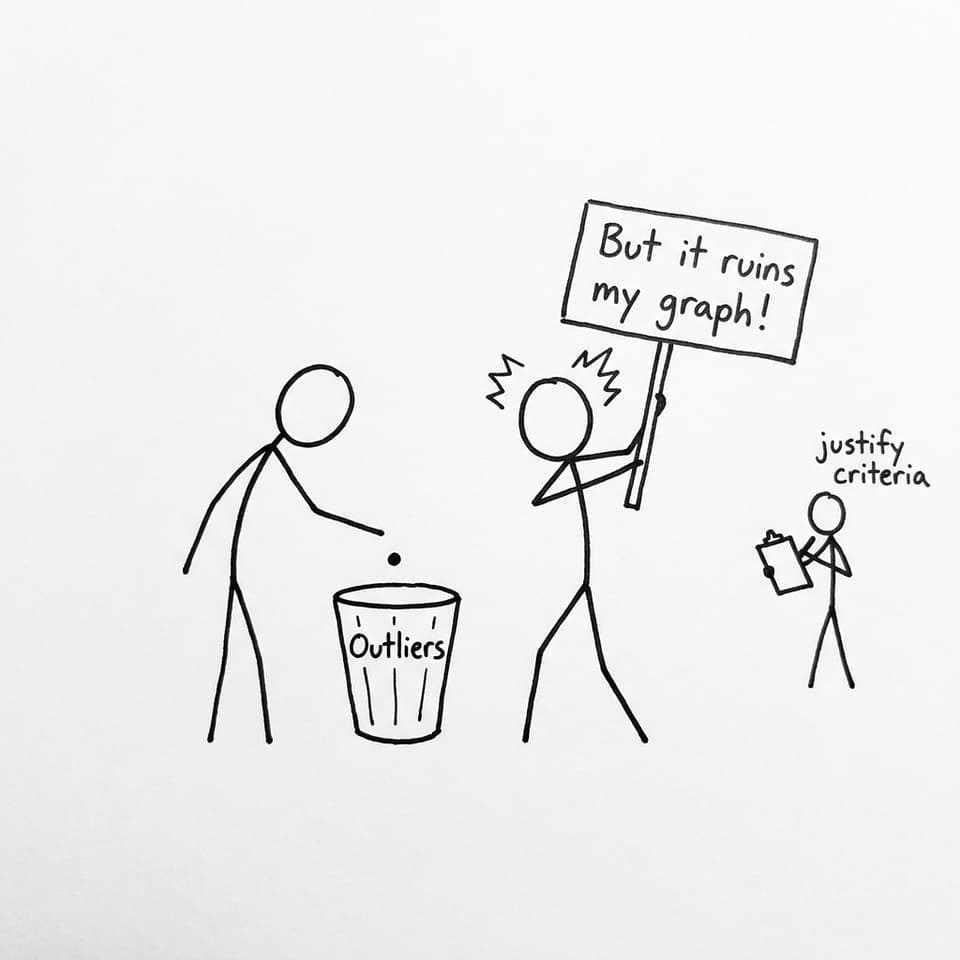
You can justify outlier handling using consistent criteria.
-
Only the most important tables/figures appear in the IA body; the rest is stored as supporting material.
For deeper guidance on how examiners want you to present evidence, bookmark: 10 Best Practices to Write Up Data and Results in Your IB IA.
Why large datasets can help an IA (and why they often don’t)
A large dataset can strengthen an IA because it can:
-
reduce random error (more trials or more participants)
-
make patterns easier to detect
-
allow stronger statistical tests or modeling
But big datasets also create common IA traps:
-
messy variable definitions (the “what does this column even mean?” problem)
-
inconsistent units/rounding
-
selective cleaning (removing “bad” points without justification)
-
bloated appendices that hide weak analysis
A helpful mindset shift: your IA is not judged on how many numbers you collected. It is judged on whether your thinking is visible.
If you want an IB-aligned breakdown of what “visible thinking” looks like across subjects, use: IB Internal Assessment Guides.
Data collection methods that scale for an IA
Large datasets usually come from one of three places. Each can work well in an IA if you plan for consistency.
Surveys and questionnaires (high volume, high risk)
Surveys scale fast. That is the good news. The bad news is that messy survey design creates messy conclusions.
Best practices for a survey-based IA:
-
Keep questions unambiguous and tied directly to your research question.
-
Decide in advance how you will code responses (especially open-ended answers).
-
Pilot test with a small group to catch confusion early.
-
Define your sampling method, and explain how it affects bias and representativeness.
If you are collecting human responses, your variable definitions matter more than ever. “Stress” or “motivation” needs a measurable operational definition, not just a vibe.
Observational studies (structured notes become structured data)
Observational data becomes “large” when you record consistently over time or across many cases.
To keep your IA defensible:
-
Create a protocol (what counts as an event, when you record, what you ignore).
-
Use standardized categories or scales.
-
Record contextual notes separately from numeric values.
In many IAs, the observation protocol is where reliability is earned. If the protocol is vague, the dataset is loud but not strong.
Secondary data analysis (fast access, serious evaluation)
Secondary datasets (from databases, published studies, or official repositories) can be excellent for a data-heavy IA because they are often larger and cleaner than what a student can collect.
But you must show judgment:
-
Why is this dataset credible?
-
What are its limitations?
-
How were variables defined by the original source?
-
Does the dataset truly match your research question?
If you are tempted to “invent” data because real datasets feel overwhelming, read this first: IB Internal Assessment: What If My IA Data Is Just AI-Generated Nonsense?.
Organizing a large dataset so your IA stays readable
Your first goal is not analysis. It is structure.
A simple structure that works:
-
Raw_Data tab (unchanged values)
-
Cleaned_Data tab (documented edits only)
-
Processed_Data tab (calculations, transformations)
-
Outputs tab (final statistics, model parameters)
-
Figures tab (graph inputs)
Add a small “Data Dictionary” box at the top of your file: variable name, definition, unit, expected range.
When you later write your IA, this prevents the classic problem: explaining the dataset takes longer than the analysis.
If you are unsure how many tables belong in the main body vs supporting material, use: How Many Tables Should an IA Include?.
Cleaning large datasets without “accidentally” biasing your IA
Data cleaning is where students quietly lose credibility. Not because they cleaned, but because they cleaned without rules.
Common cleaning tasks you should document
-
removing duplicates
-
fixing inconsistent units (cm vs m)
-
standardizing categories ("yes", "Yes", "Y")
-
handling missing values
-
checking impossible values (negative time, 400% humidity)
Outliers: the rule is “justify, don’t hide”
Outliers are not automatically “wrong.” Sometimes they are the most interesting part of the story.
In your IA, do this instead:
-
Define an outlier criterion (IQR rule, z-score threshold, instrument limits, or contextual reasoning).
-
Show results with and without outliers if it changes conclusions.
-
Explain what you think the outliers represent (error, rare event, uncontrolled variable).
For a clean IB-style approach to turning messy results into clear analysis, see: How to Use Data Effectively in Your IA Analysis.
Tools to analyze large datasets (without overcomplicating the IA)
You do not get extra marks for using the fanciest tool. You get marks for choosing a tool that matches your question.
Practical options:
-
Excel / Google Sheets for sorting, pivot tables, graphs, basic statistics
-
R / Python for reproducible workflows, larger datasets, advanced models
-
SPSS for streamlined statistical testing
Whatever you choose, focus on explainability. In an IA, the examiner must understand what you did.
A useful training loop: learn the technique, then practice interpreting outputs under pressure. RevisionDojo’s Study Notes help you understand methods quickly, and the Questionbank helps you practice data interpretation and command-term responses the IB way.
Presenting big data in a small word count
A strong IA does not dump. It curates.
Aim for:
-
one table that shows a representative sample of raw data
-
one processing table that proves your method
-
one summary table that tells the reader what matters
-
graphs that highlight trends with appropriate labels, units, and uncertainty handling
You are allowed to keep the full dataset as supporting material, but the body should read like an argument, not a storage unit.
If you want to see how this looks in a real investigation narrative, compare your structure to: Sample IB Biology IA: A Step-by-Step Example.
Closing: make your IA dataset easy to trust
A large dataset can make your IA stronger, but only if it becomes readable. The best IAs treat data like a promise: “Here is what I measured, here is how I processed it, and here is why the conclusion follows.”
If you want to tighten that promise, use RevisionDojo as your support system: build clarity with Study Notes, test your interpretation skills with the Questionbank, and use rubric-focused guidance from the IA Guides. Big data does not impress examiners by existing. It impresses them when your IA makes it understandable.